Monitoring IBM Cloud Kubernetes Service with Outlyer
Outlyer now supports IBM Container Cloud
A Comparison Between Prometheus and Outlyer
An overview of the key differences between Prometheus & Outlyer
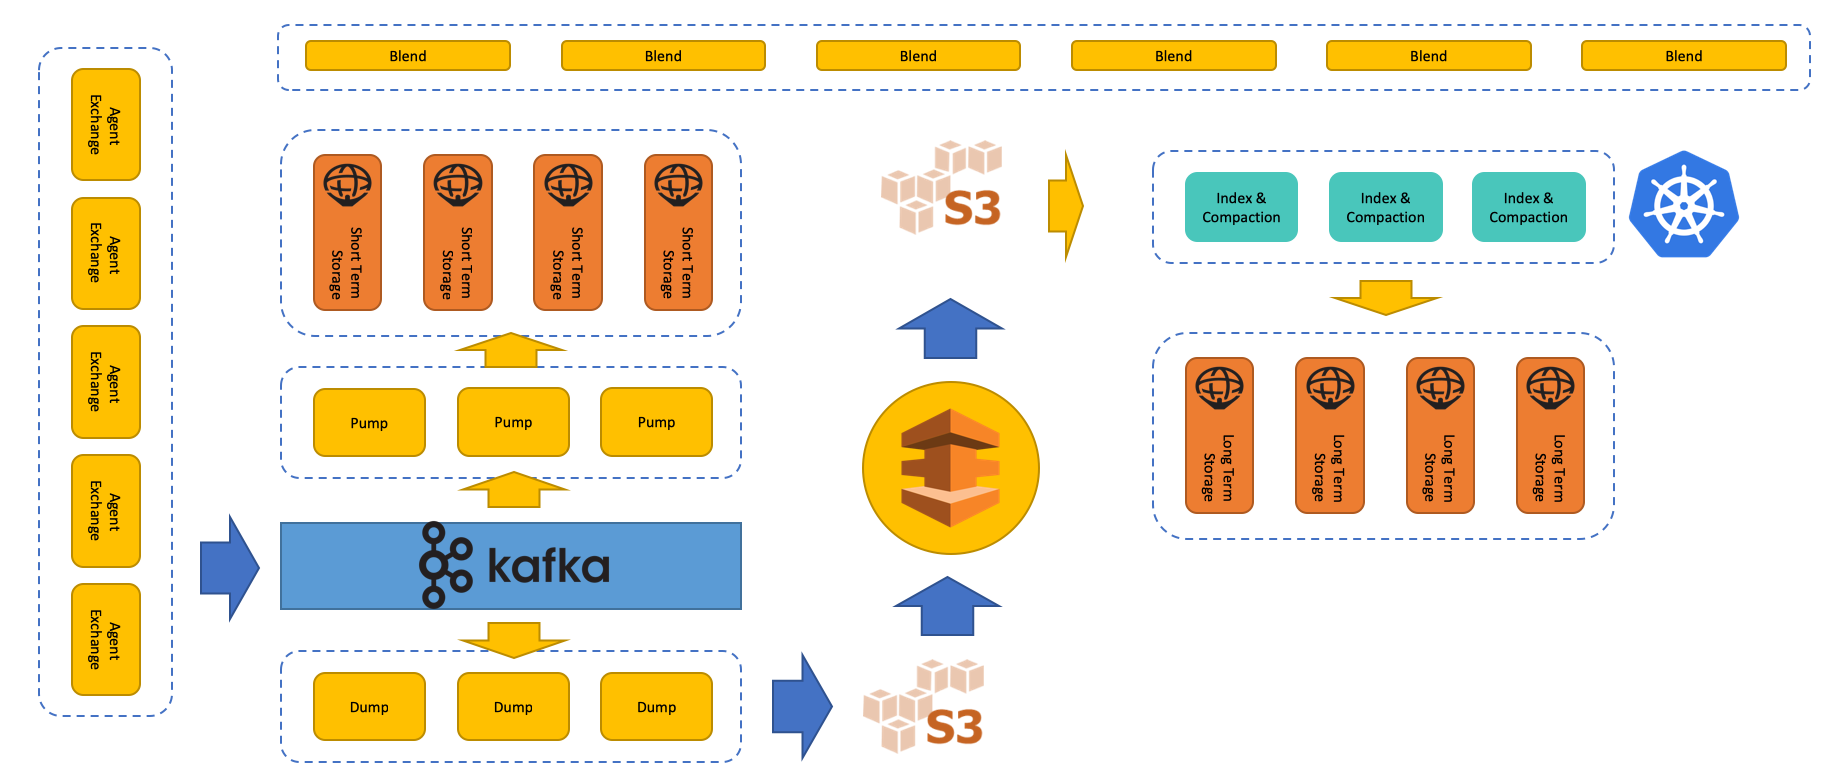
Why NOT to Build a Time-Series Database
Our story building and scaling a time-series database and our new V2 architecture

Building a Raspberry PI Weather Station with Outlyer
A 7th Grade Science Project to Build a Raspberry PI Weather Station with Outlyer
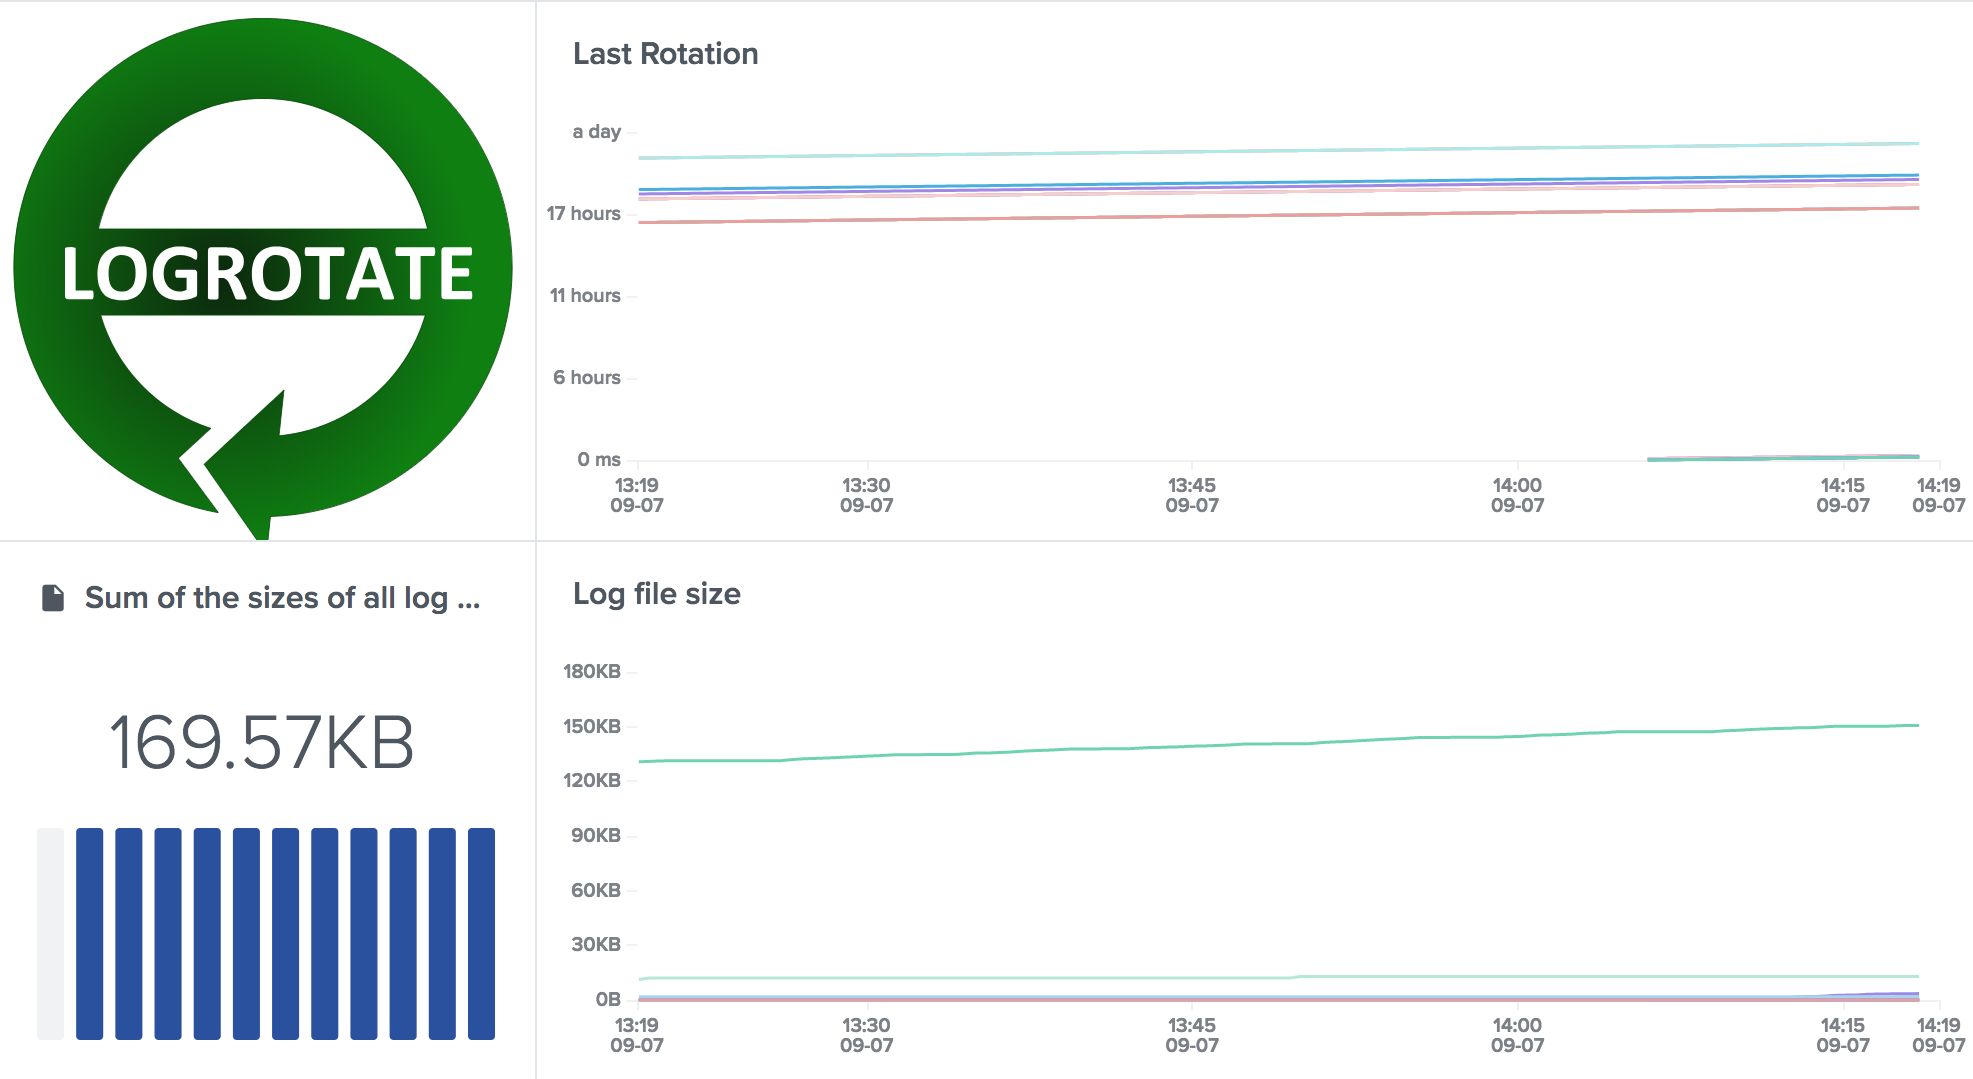
Monitoring Logrotate with Outlyer
Learn how to use logrotate and how to monitor it with Outlyer
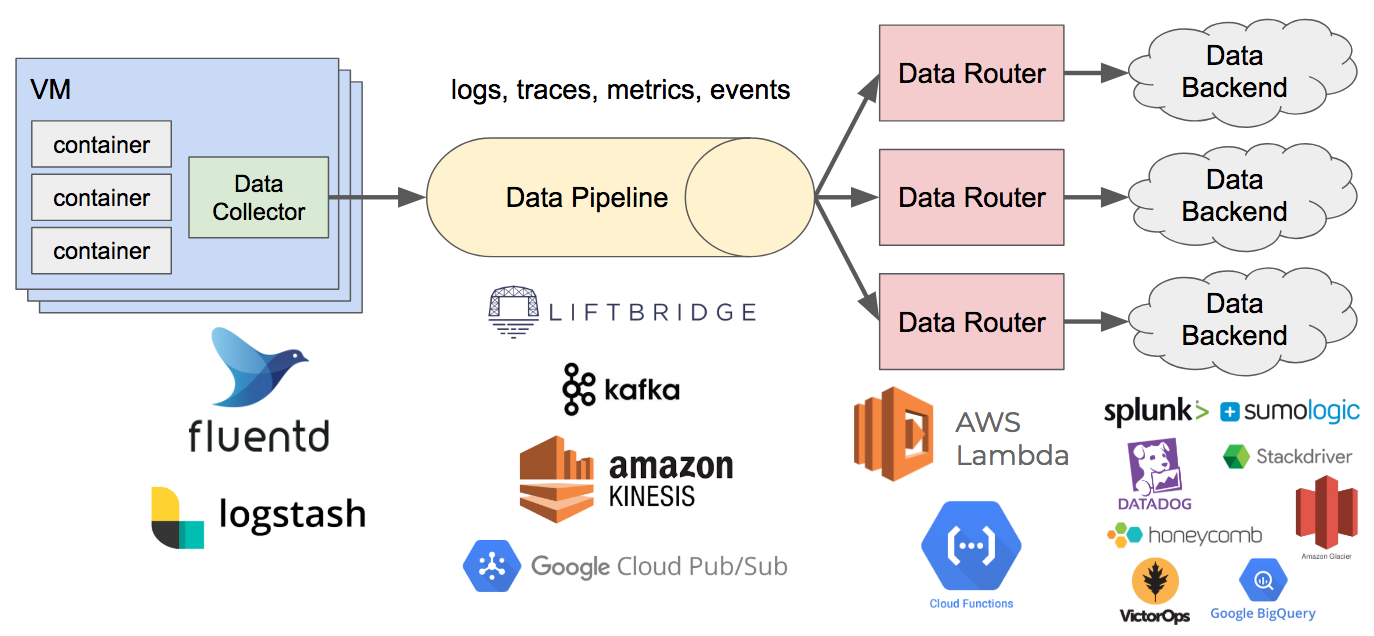
Why The Observability Pipeline Won't Solve Everything
Response to recent ideas of building an Observability Pipeline
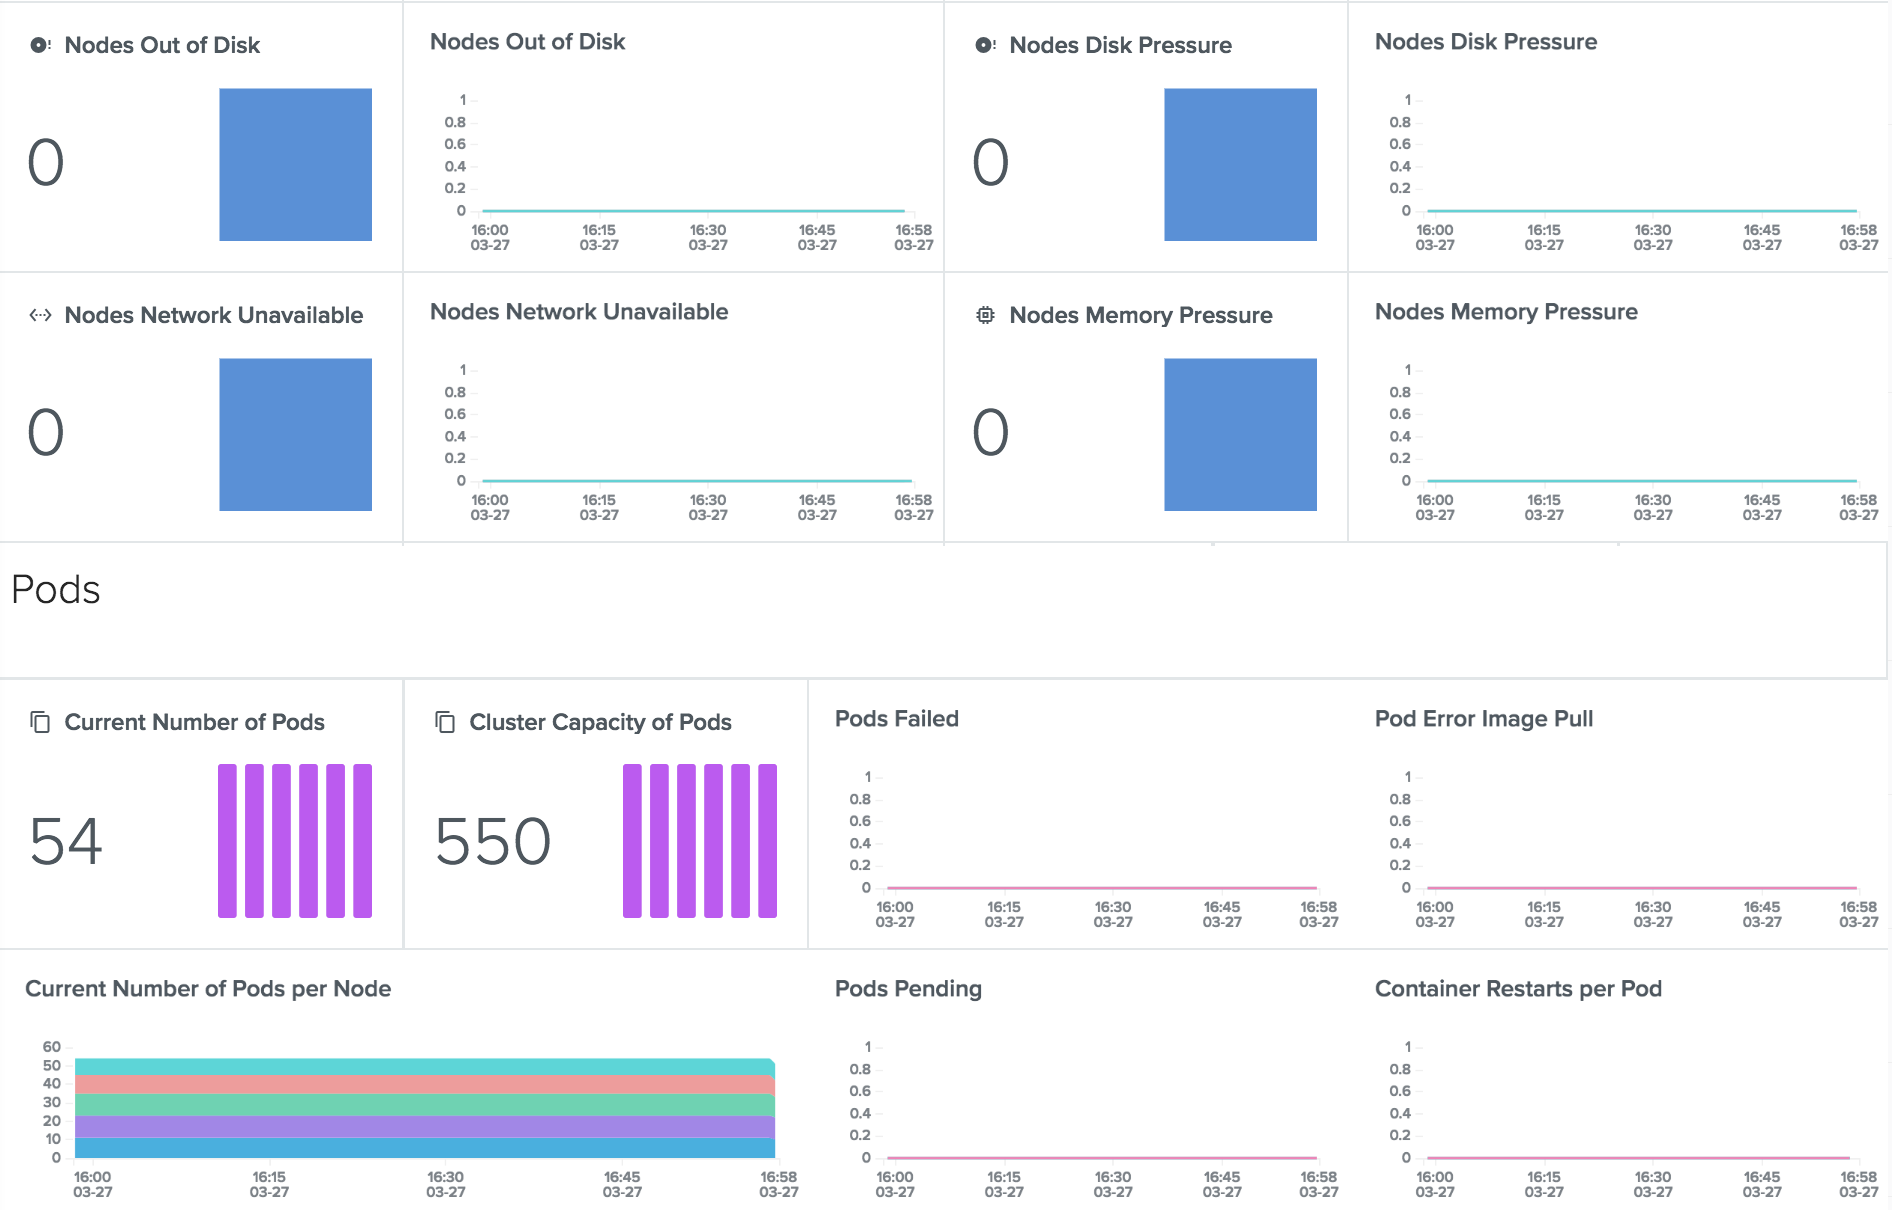
Top Kubernetes Metrics to Monitor (Part 4)
An overview of the key metrics that matter on your Kubernetes cluster
How To Monitor Kubernetes With Outlyer (Part 3)
How Outlyer makes Kubernetes monitoring simple

Monitoring Kubernetes With Heapster And Prometheus (Part 2)
This post covers Kubernetes metrics monitoring using Heapster and Prometheus.
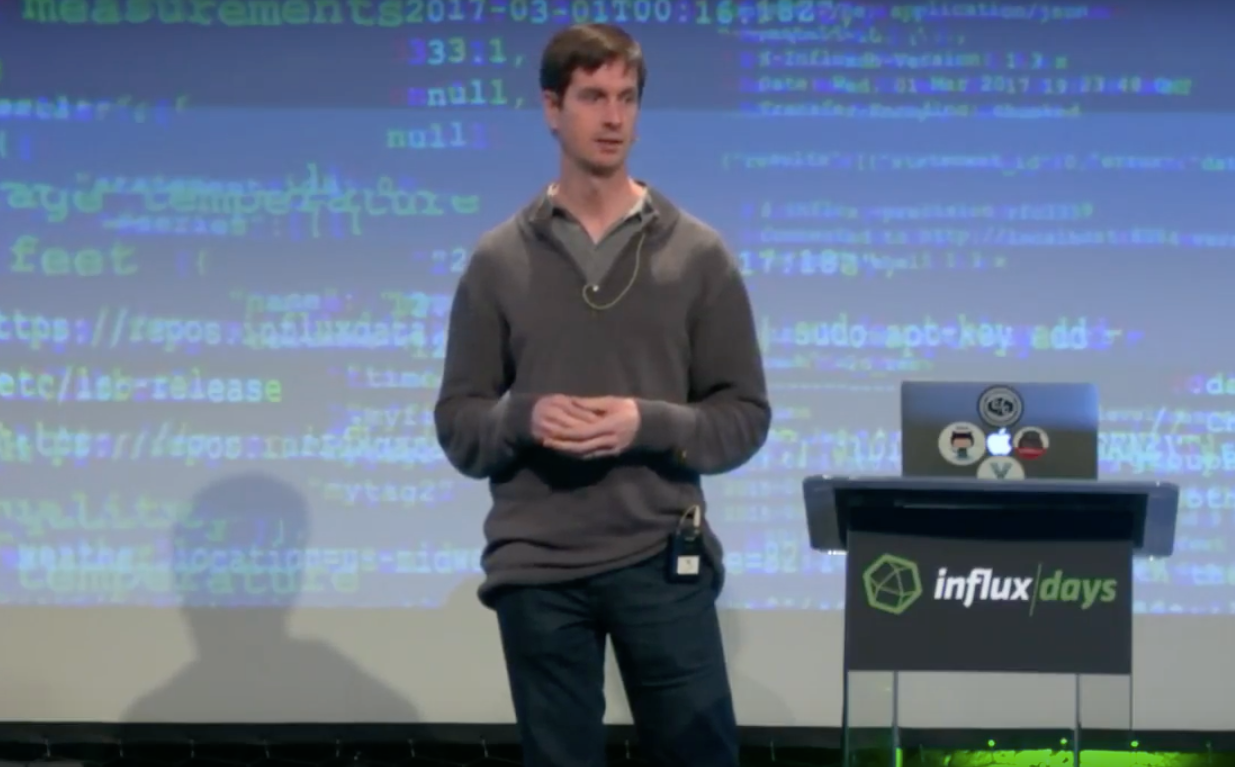
Baron Schwartz: What Good is Anomaly Detection?
Baron's talk from InfluxDays about anomaly detection
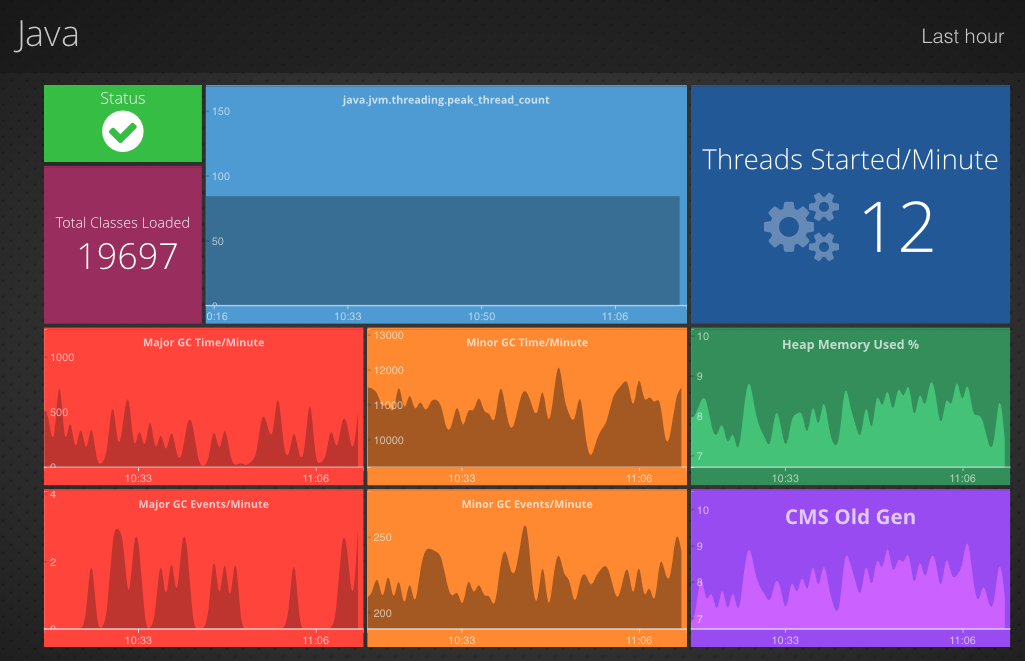
Introduction to Monitoring Java Applications
This post covers monitoring the performance of a Java application

Are the Pitfalls of Microservices and Docker Containers Worth It? (Hint: Yes!)
The pros and cons of using Docker in microservices architectures


Java Monitoring Using JMX
This article provides some examples of how to access monitoring information using JMX
How to supercharge AWS CloudWatch
In this post, we’ll take a look at how you can extend CloudWatch

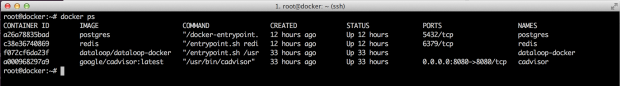
Why You Should Monitor Services Rather Than Containers
Do you realize what Docker means for application monitoring? It’s a game-changer!

Monitoring Docker Environments with Outlyer (Live Webinar)
How Outlyer is changing the way you can monitor your Docker environment

Monitoring is a Journey, Not a Destination
Why we designed Outlyer to be as frictionless as possible
Build vs. Buy (Prometheus)
Prometheus takes a lot of time to build and scale, here's the reality
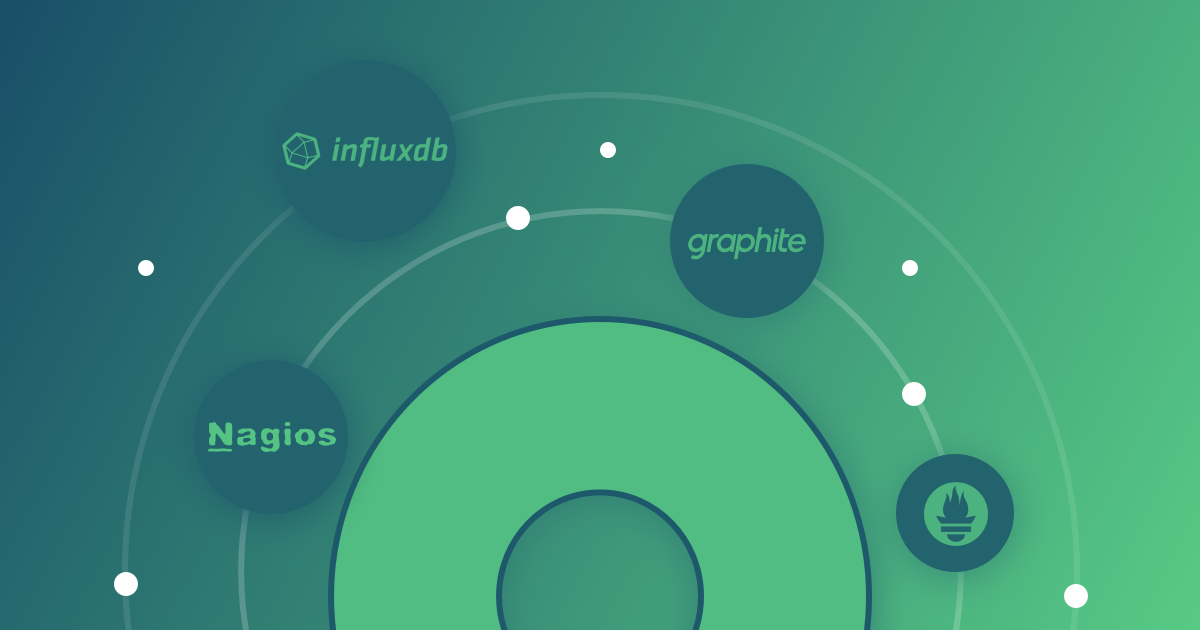
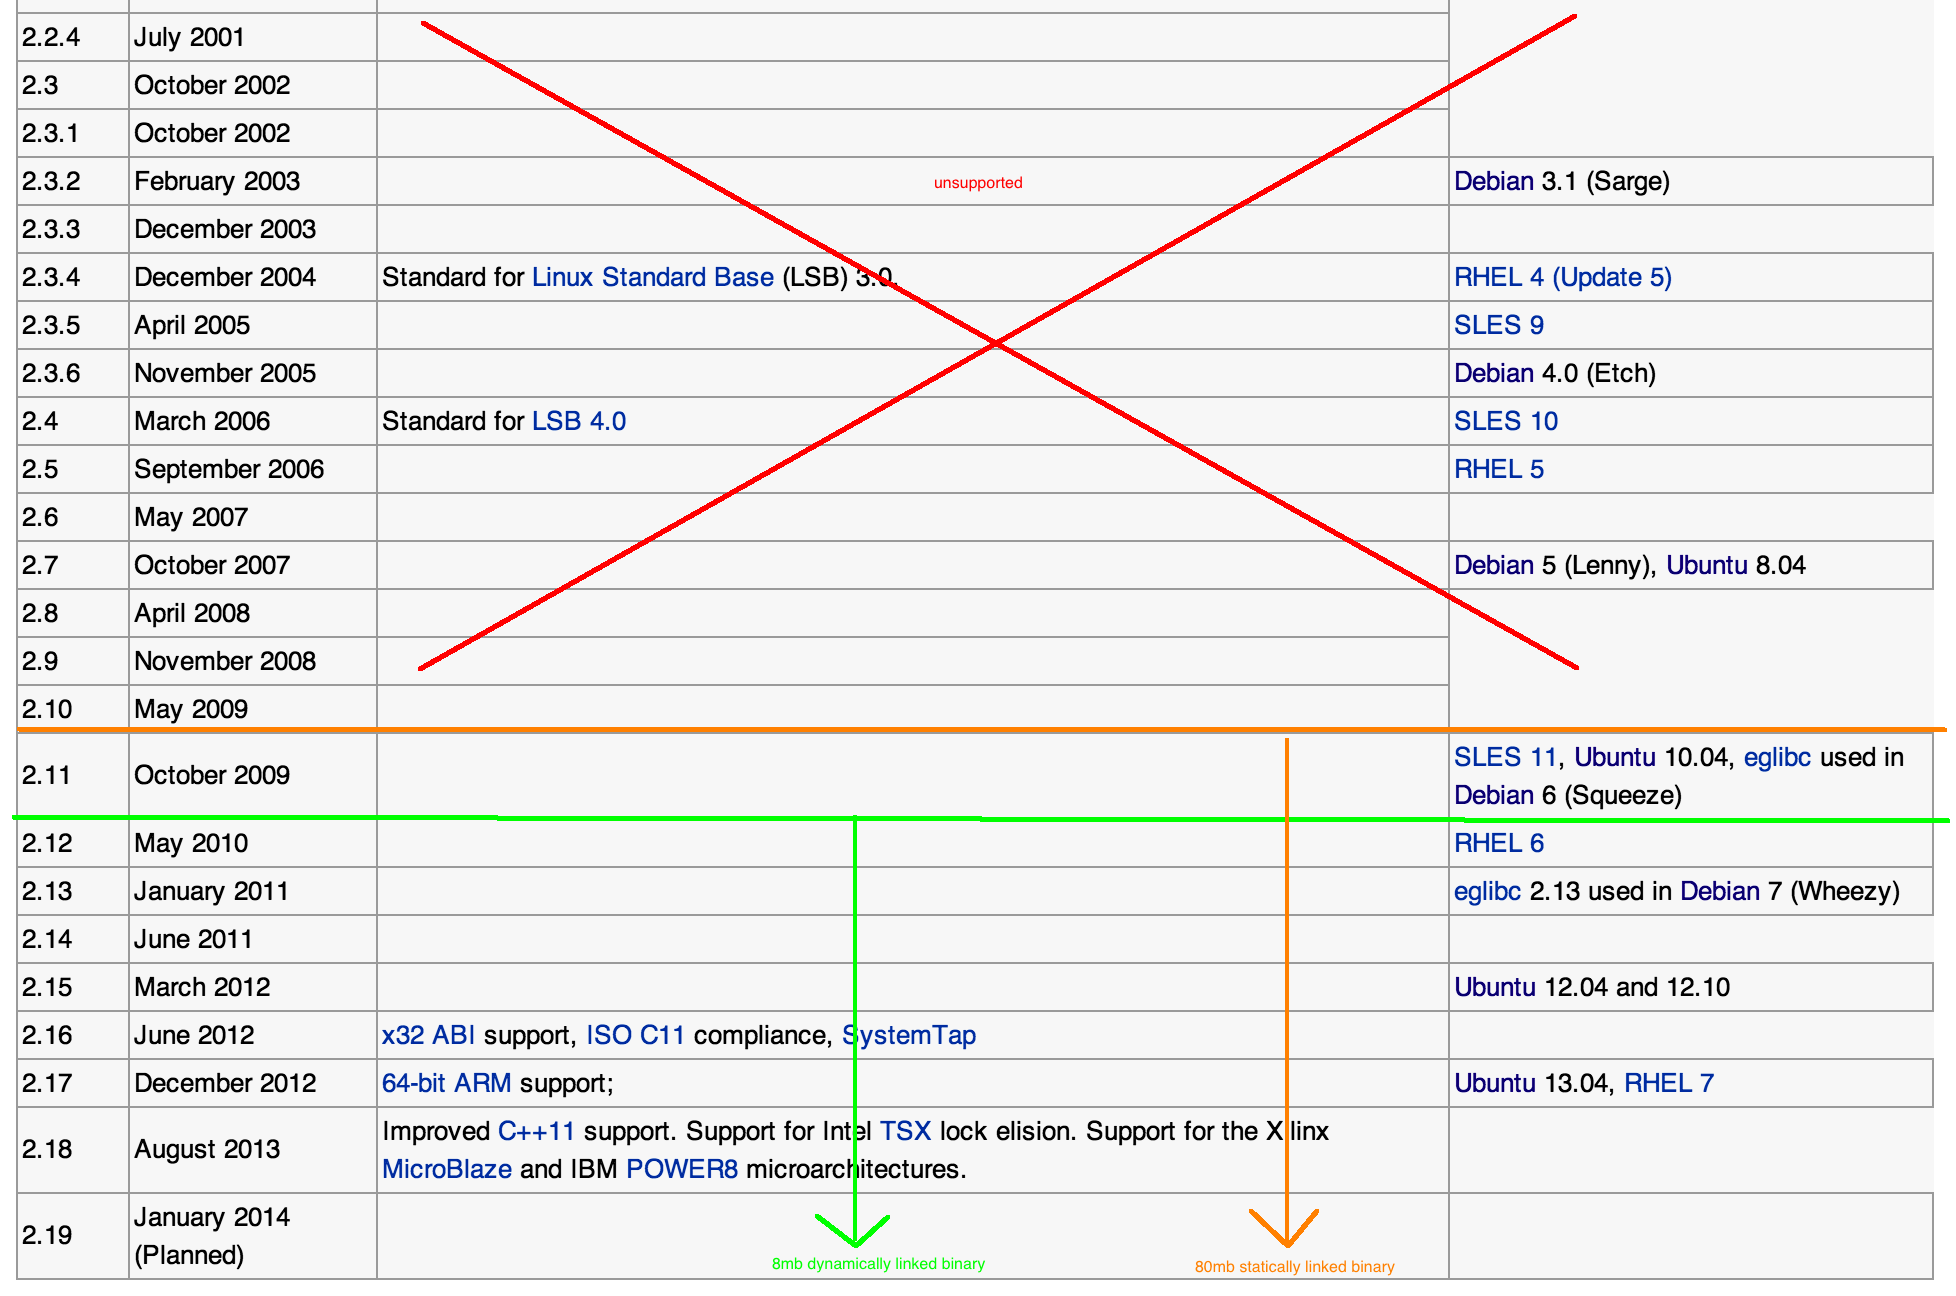
Metrics: Nagios, Graphite, Prometheus & InfluxDB
Some Thought on Open Source Monitoring (push vs. pull)


Hosted Prometheus
Need a Service Similar to Hosted Prometheus? I'd Say Outlyer is Pretty Close
The Ultimate Guide to Monitoring Microservices
Download our free eBook on Monitoring Microservices
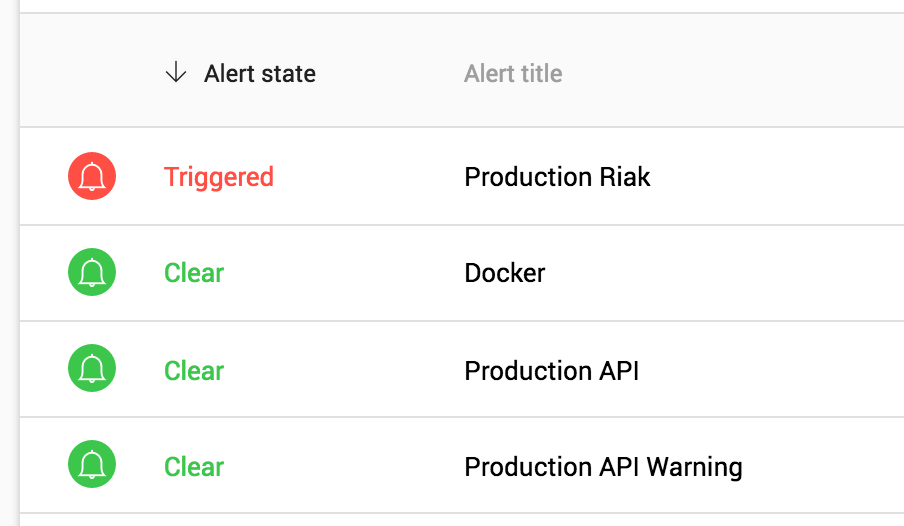
A Practical Guide to Alerting
Alerts should be simple to understand and actionable when triggered, here's how
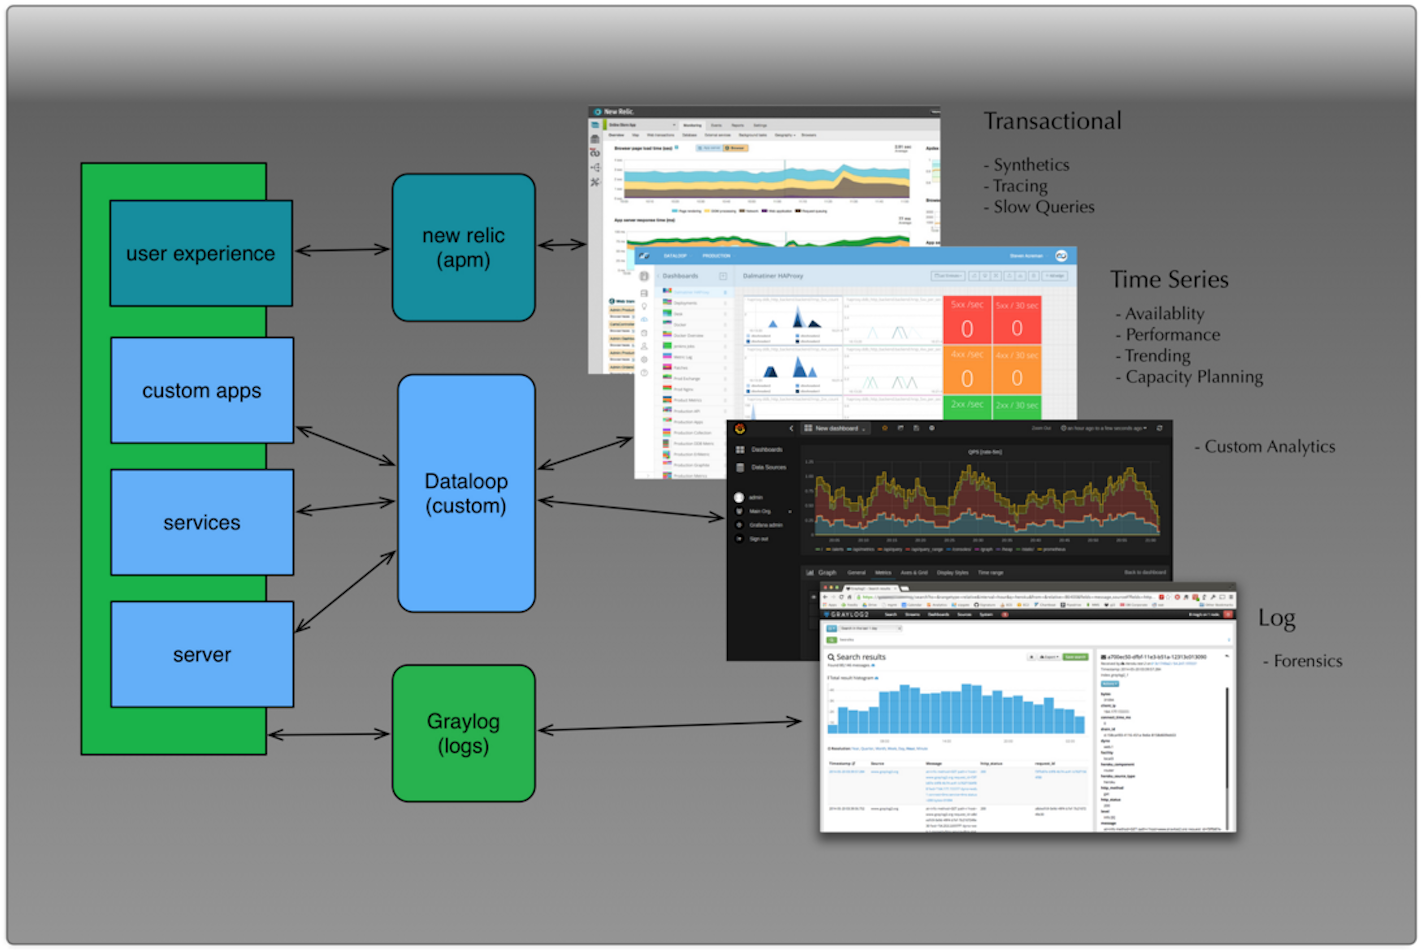
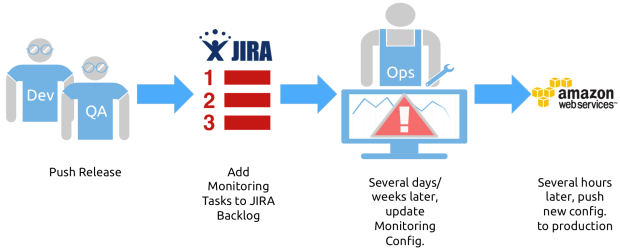
A typical monitoring project
It's Not Always Easy to Tackle a Monitoring Project, Here Are Our Advice
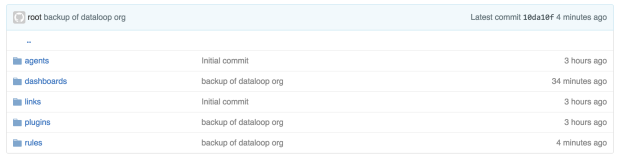
Monitoring Configuration - Files vs Databases
Overview on how different open-source monitoring tools store their configuration
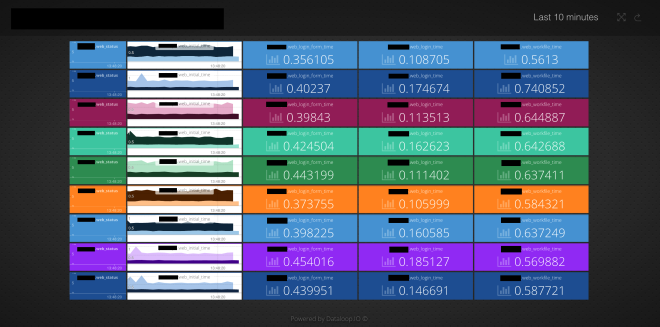
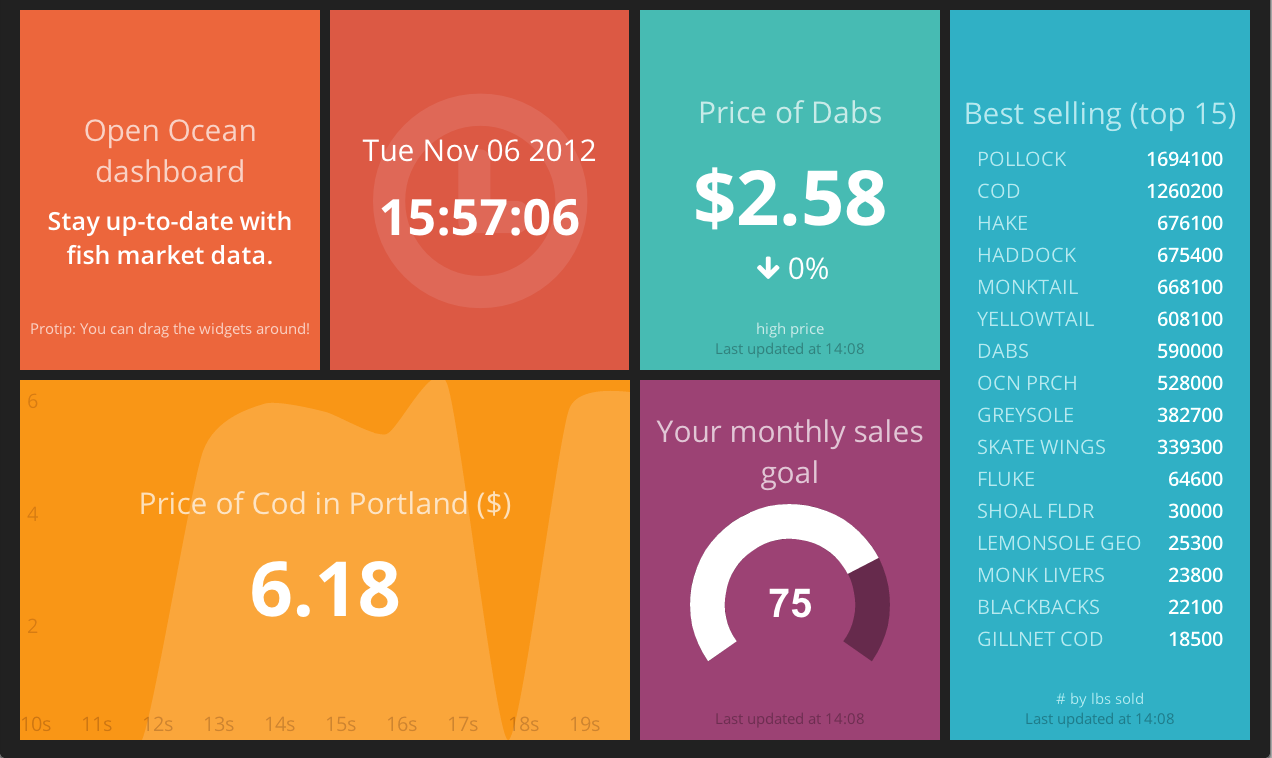
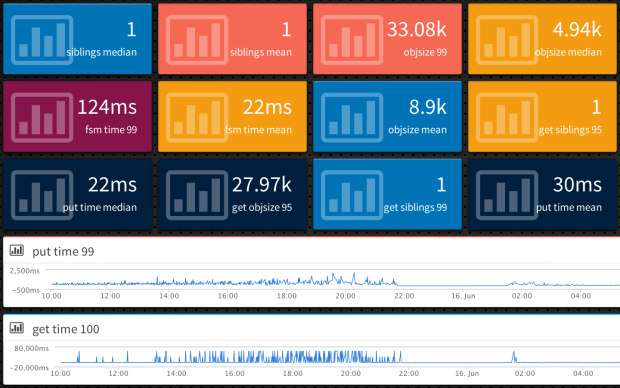
Dashboard Examples - DevOps Dashboards
Example Dashboards to bring development and operations together and improve the service
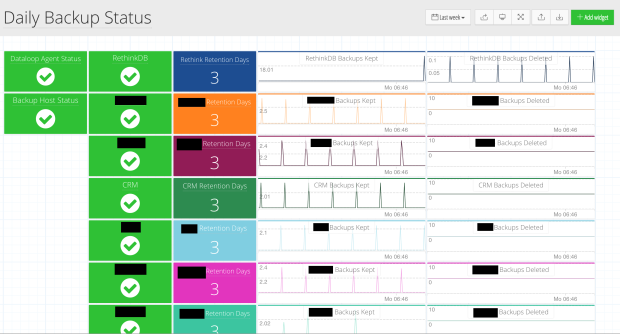
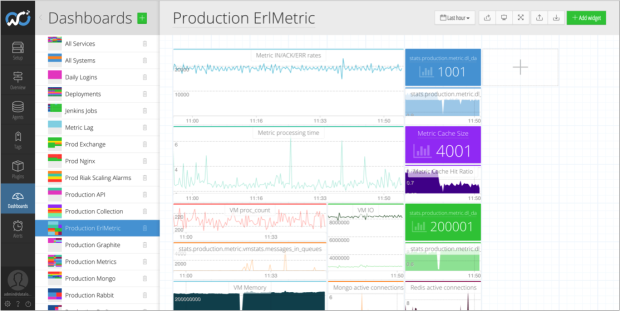
Dashboard Examples - Developer Dashboards
Example monitoring dashboards useful for Developers

Dashboard Examples: Background
An introduction to our blog series on example Monitoring dashboards

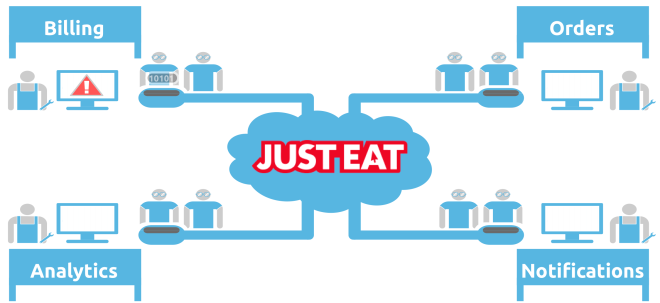
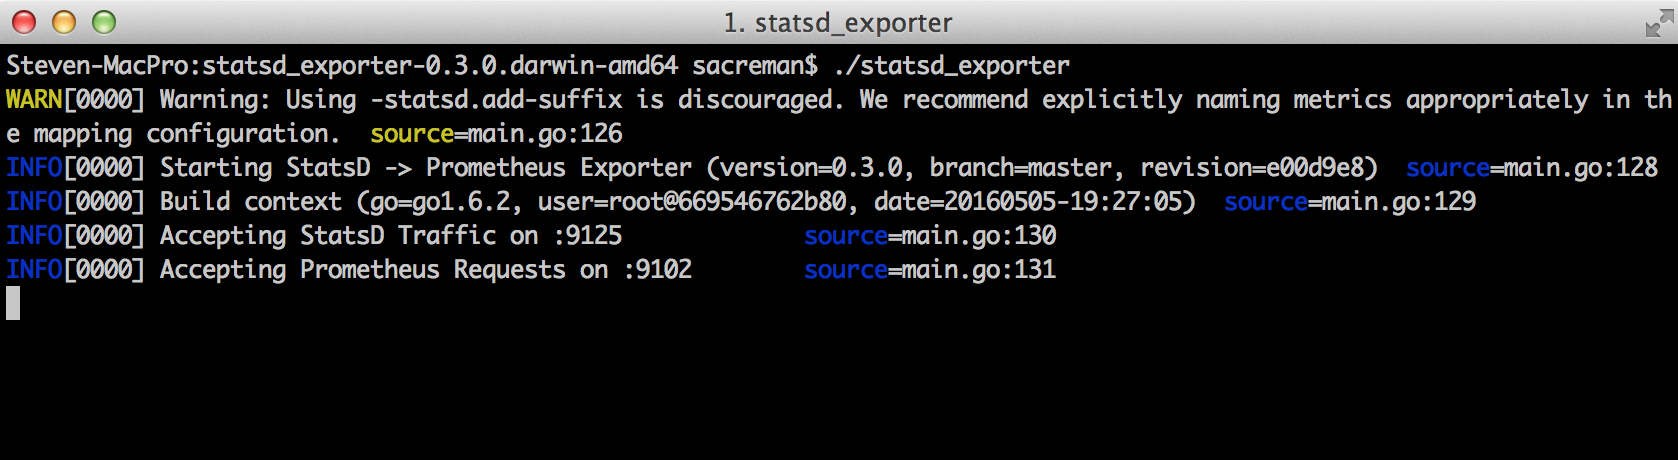
Monitoring Java apps with Nagios, Graphite and StatsD
How to monitor Java services with open-source tools Nagios, Graphite & StatsD
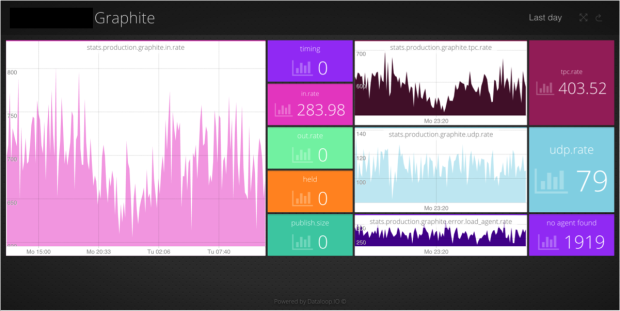
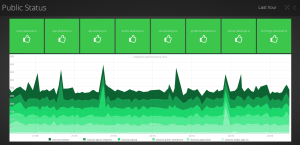
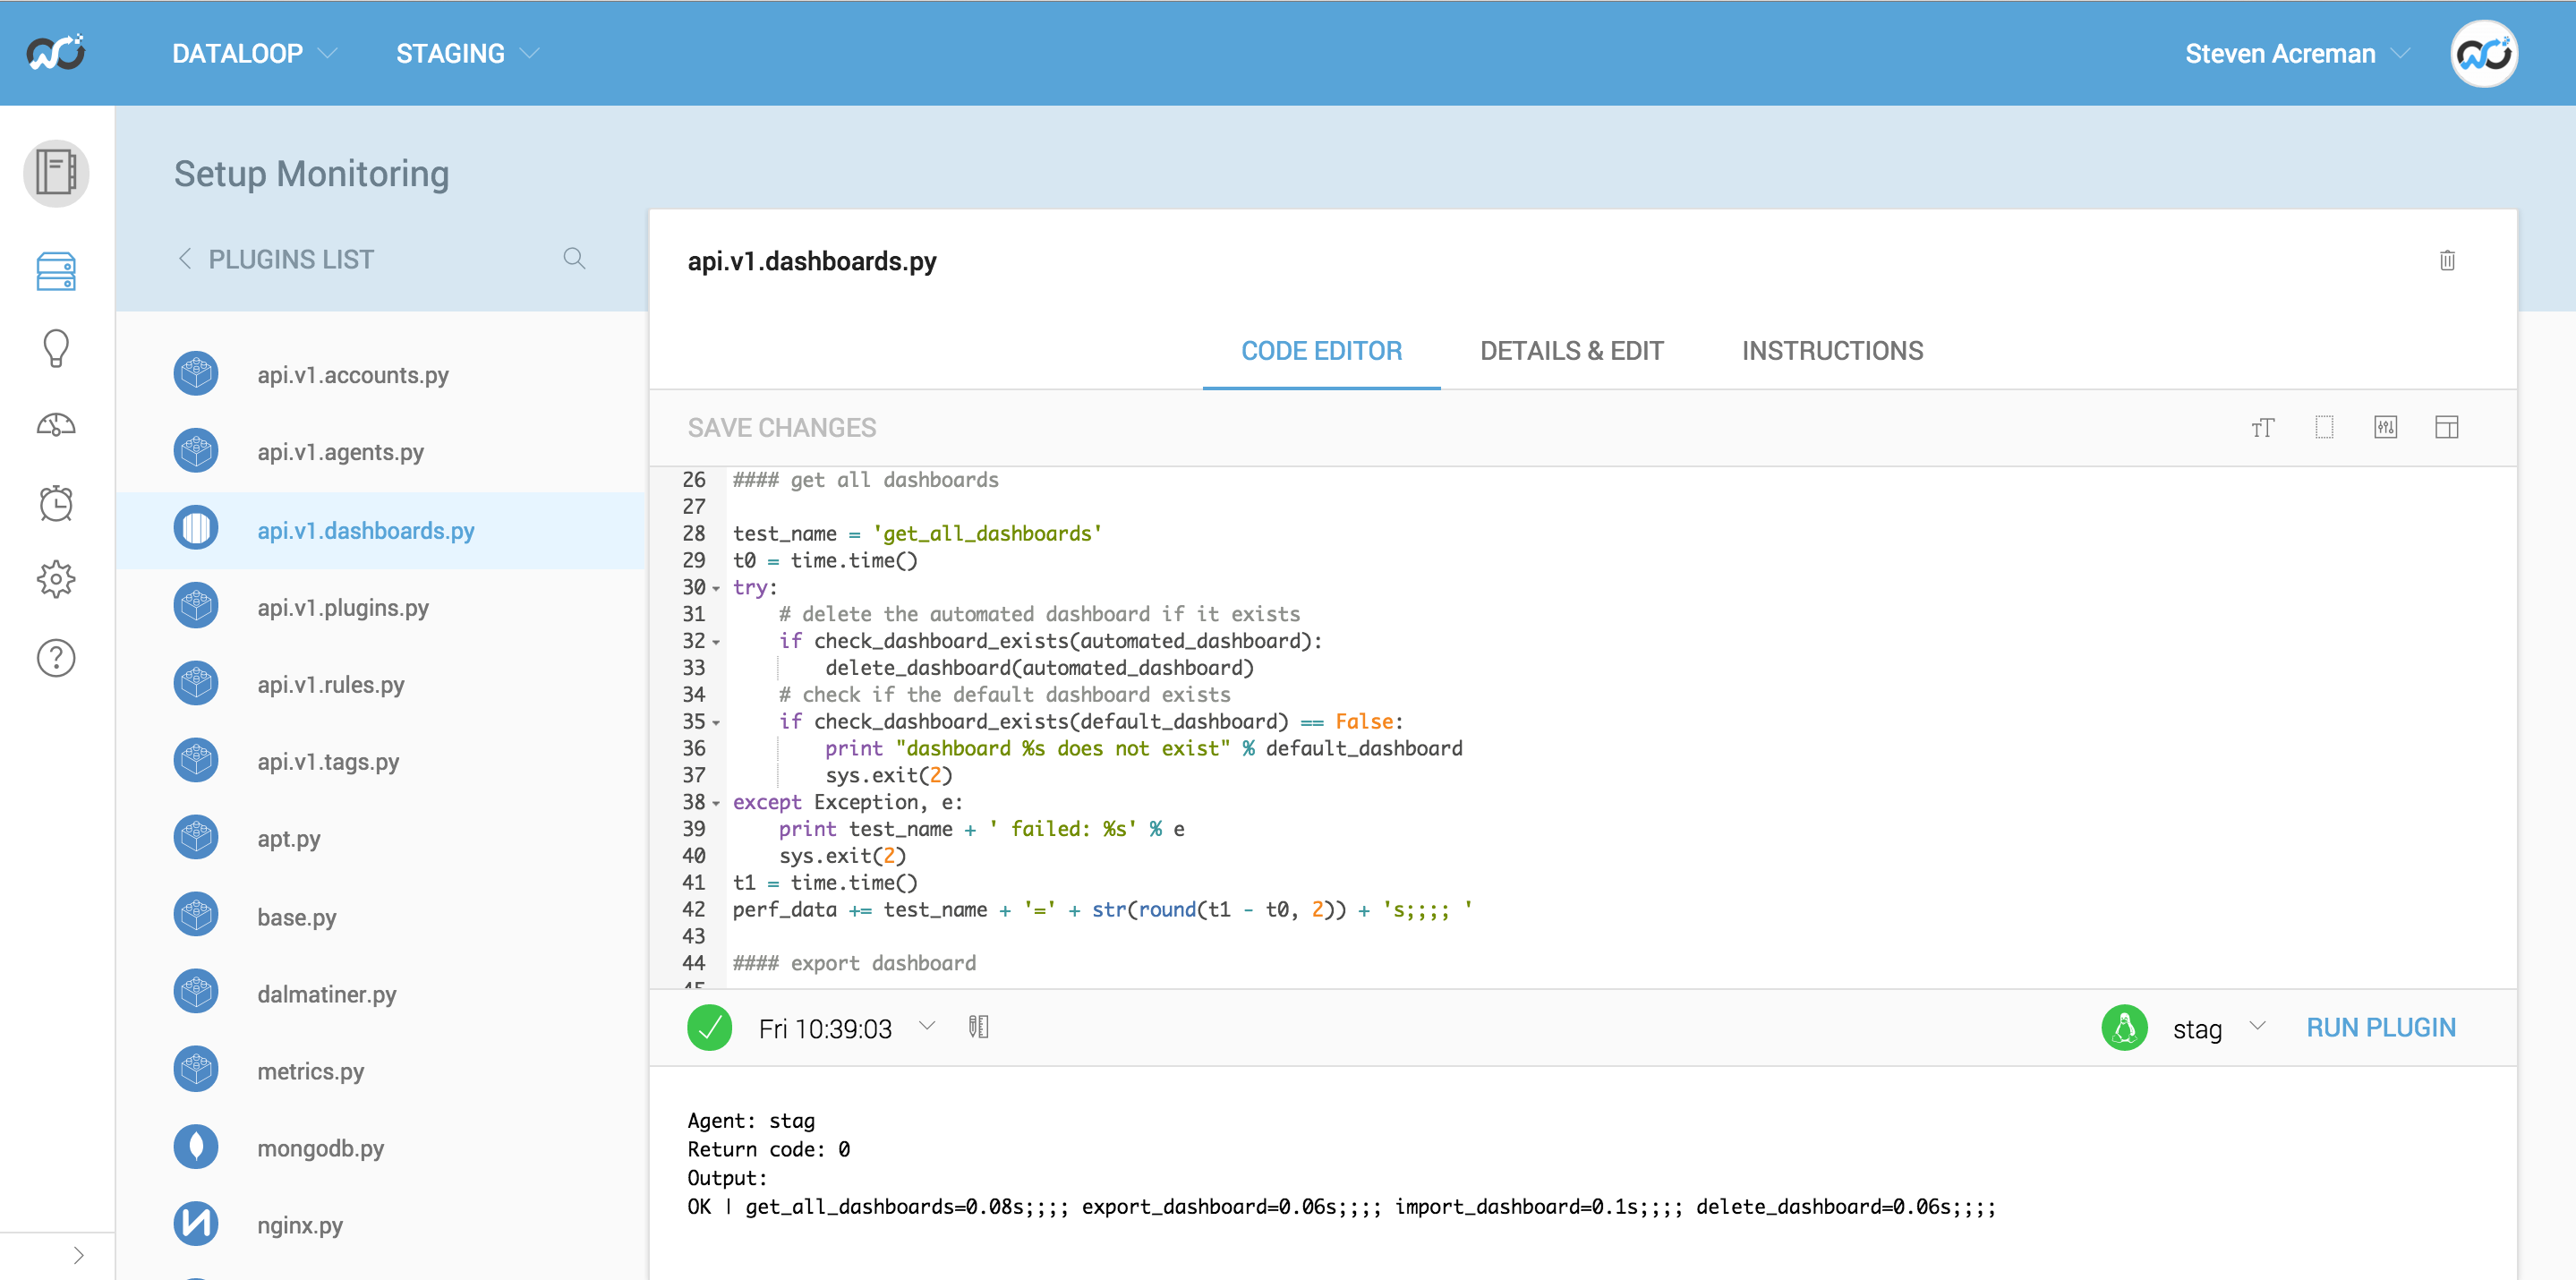
Automated Status pages with Status.io Plugin
How to build your own Status.io dashboard using Outlyer
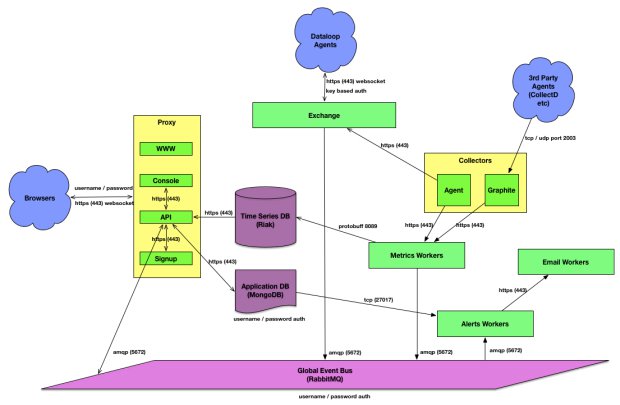
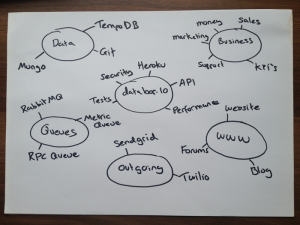
How we scaled our monitoring platform
An overview of the Outlyer architecture and how we scale it

Throwing the baby out with the bathwater
How some new monitoring concepts discard steadfast truths

Using Monitoring Dashboards to Change Behaviour
How Monitoring Dashboards can be used to change behaviour in your organization

Why We Chose Outlyer for Hive Home - Grant Smith
Grant Smith shares why he chose Outlyer to monitor Hive Home
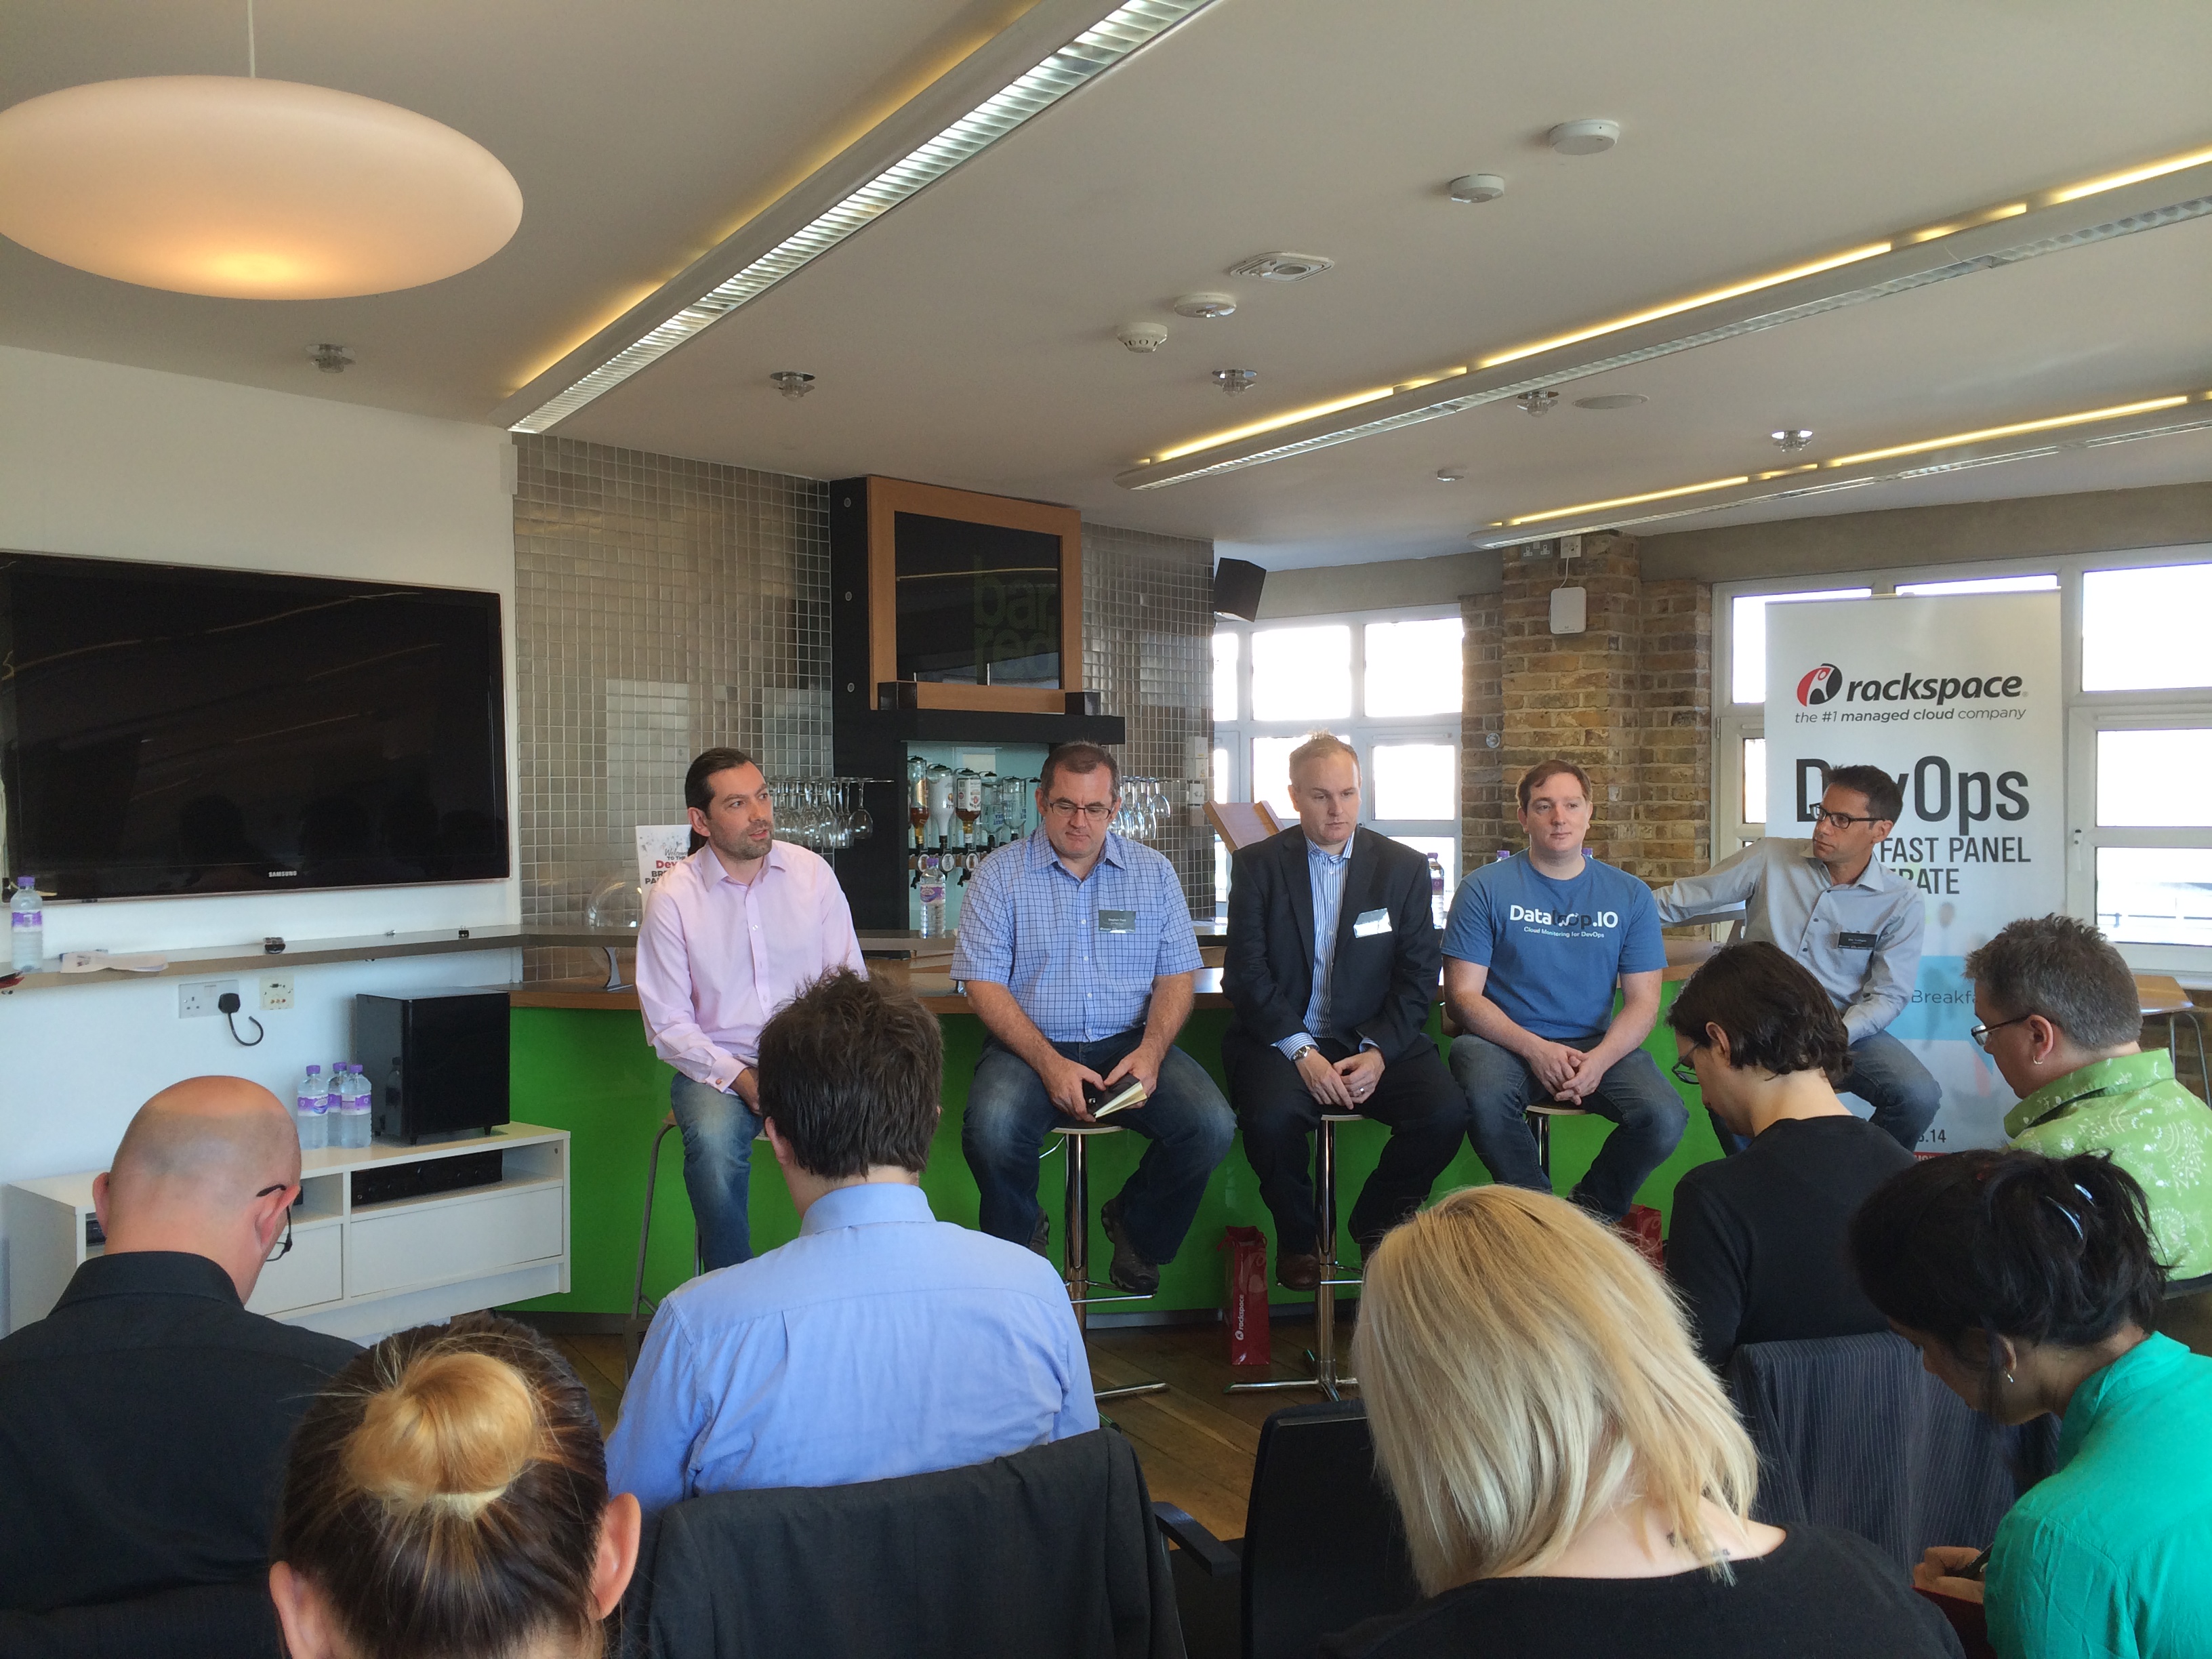
Rackspace Breakfast Panel Debate
A talk about DevOps at Rackspace’s Breakfast Panel Debate
7 Ways to Get Adoption of Your Monitoring Tool
Our top 7 ideas on what will make your monitoring tool more popular outside your team
Why Adoption Outside Operations for Monitoring is Important
The challenges and solutions to getting adoption of the monitoring tools outside Operations.
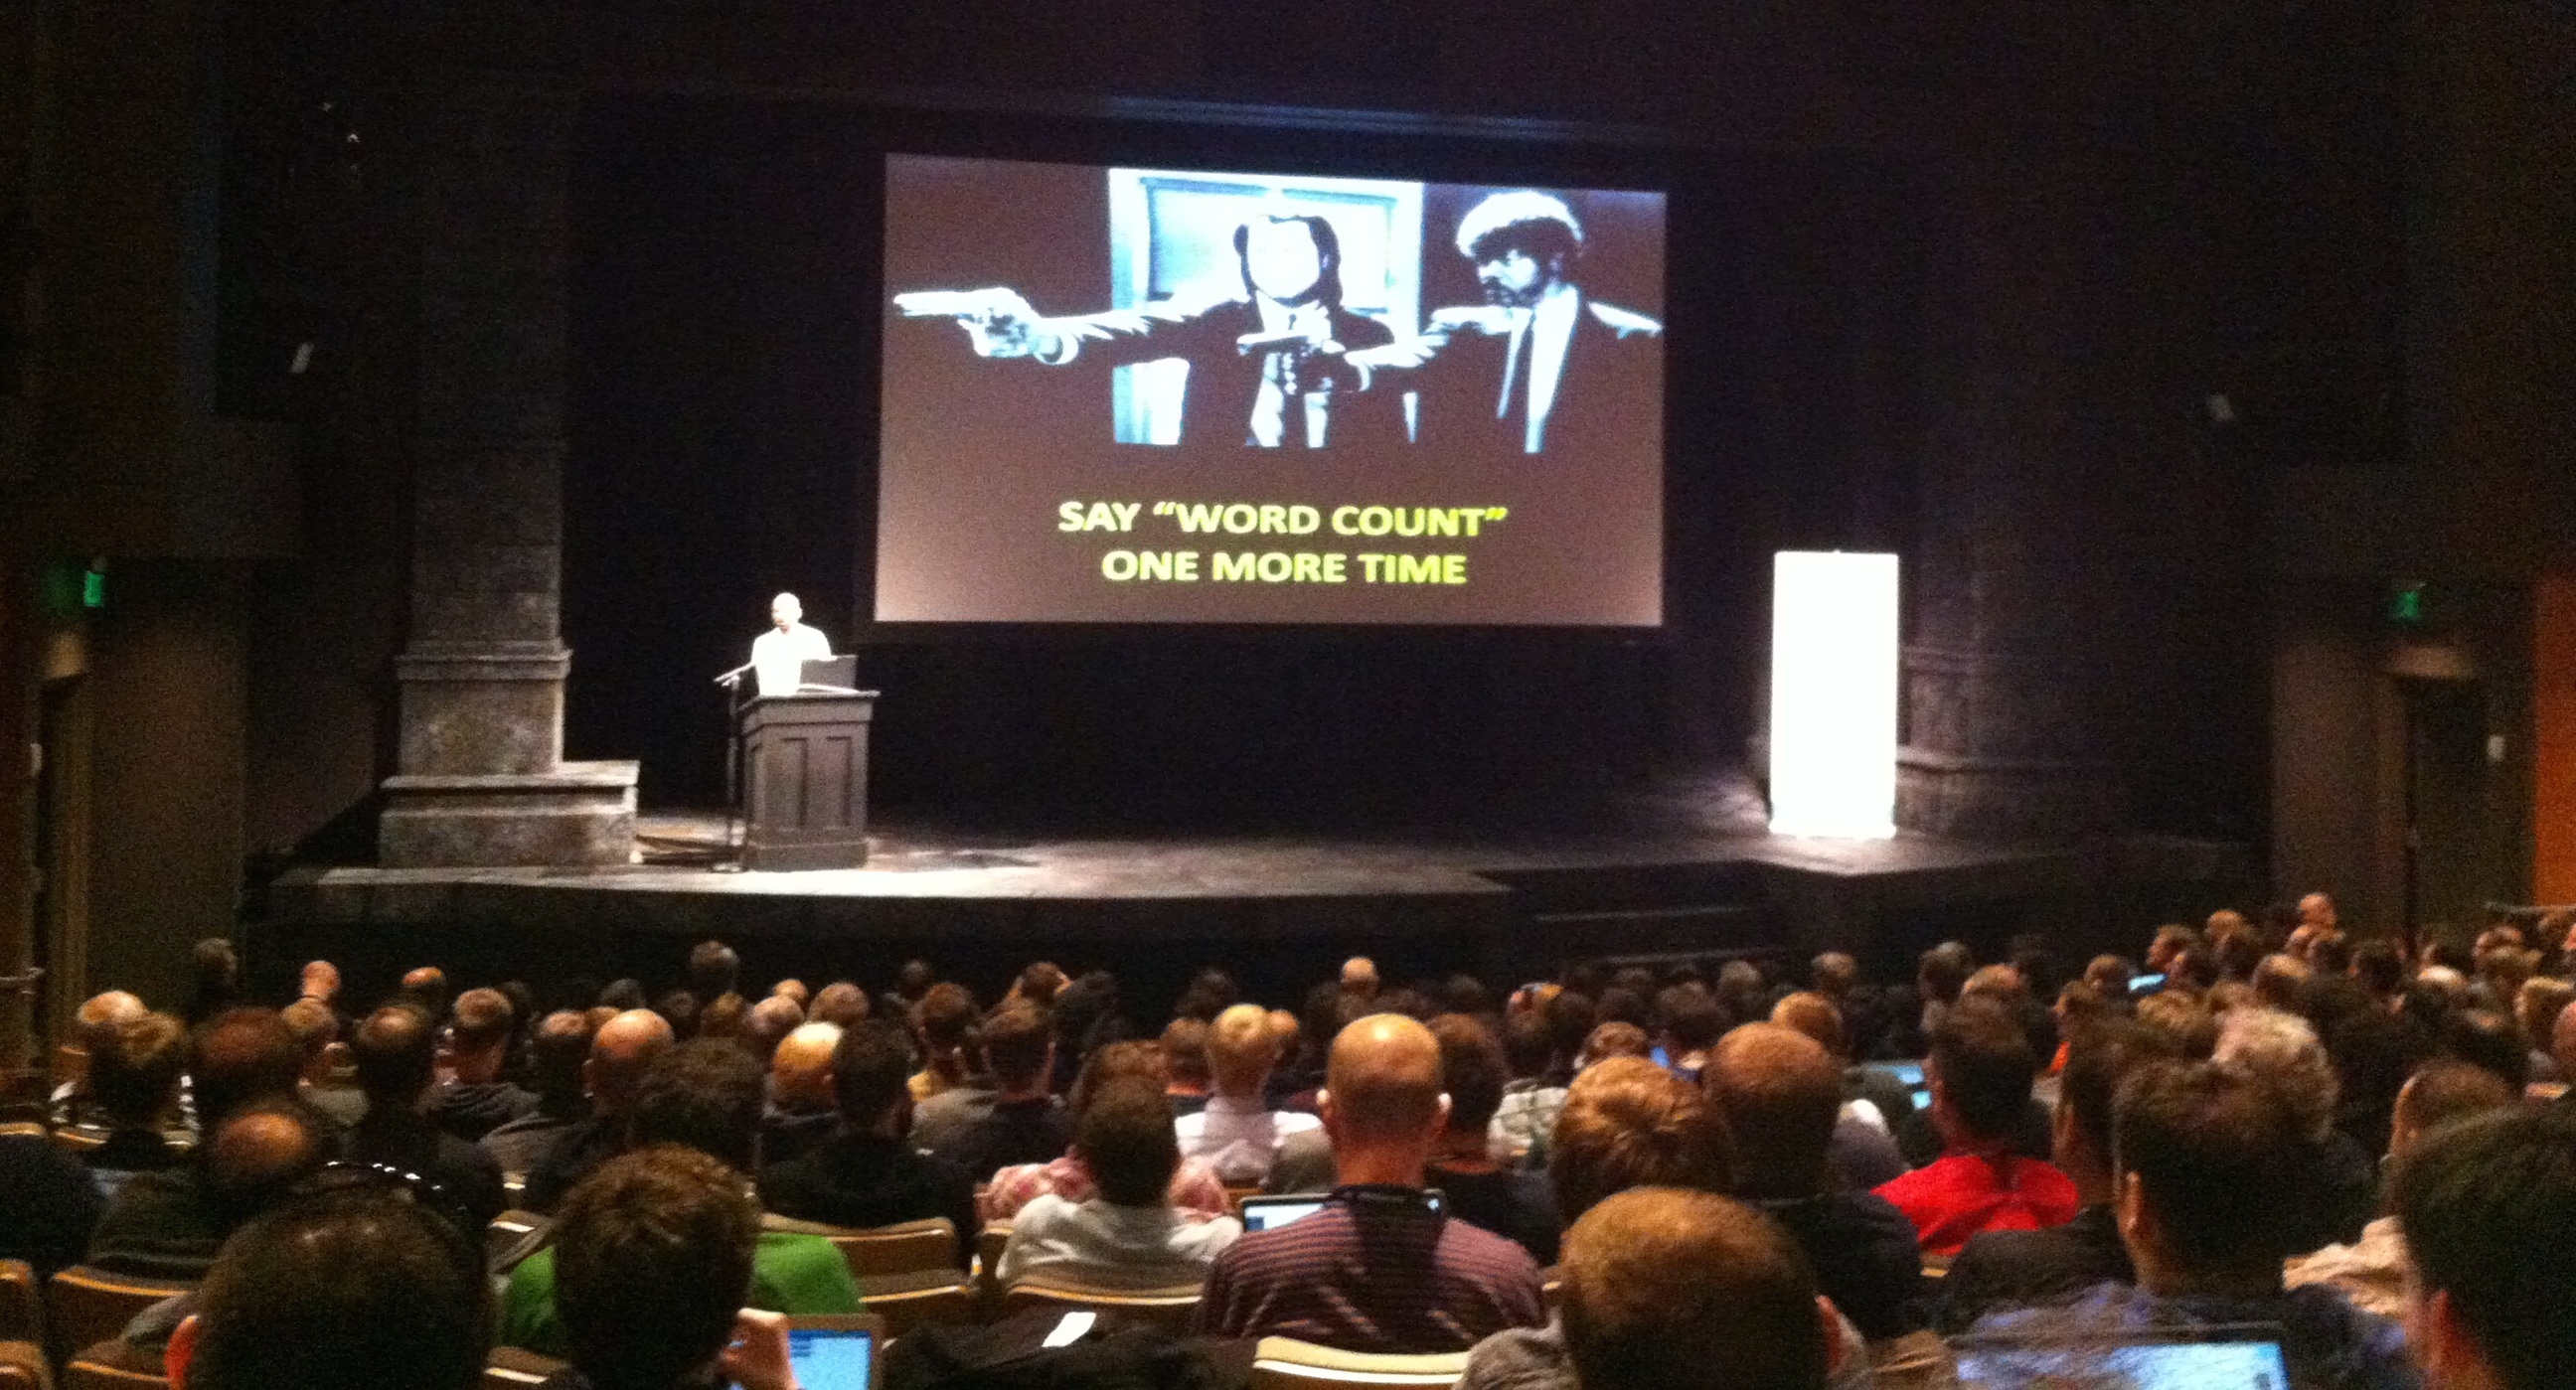
Our First Public Preview @ Monitorama 2014
Videos and slides from our second DevOps Exchange London meetup on Microservices

Collecting Metrics
An overview of the key formats used to collect metrics in monitoring systems

What We Learned Talking To 60 Companies About Monitoring
The results of our monitoring survey with 60 companies and key findings


The Art of Good Alerting
How you should think about your alerts when setting up monitoring
What Do I Need to Know?
How to organise your monitoring in a way that supports your service