
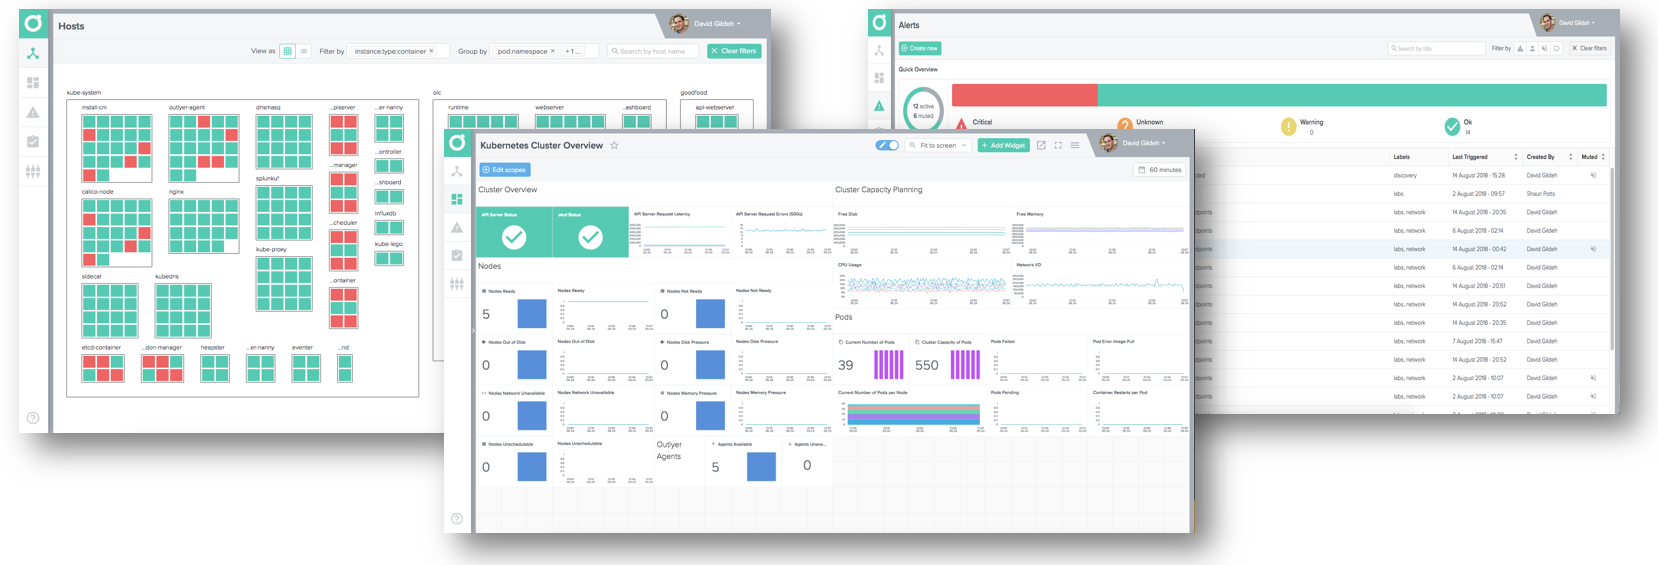

New Feature: Docker Monitoring
Our new Docker monitoring solution that can literally be setup in minutes


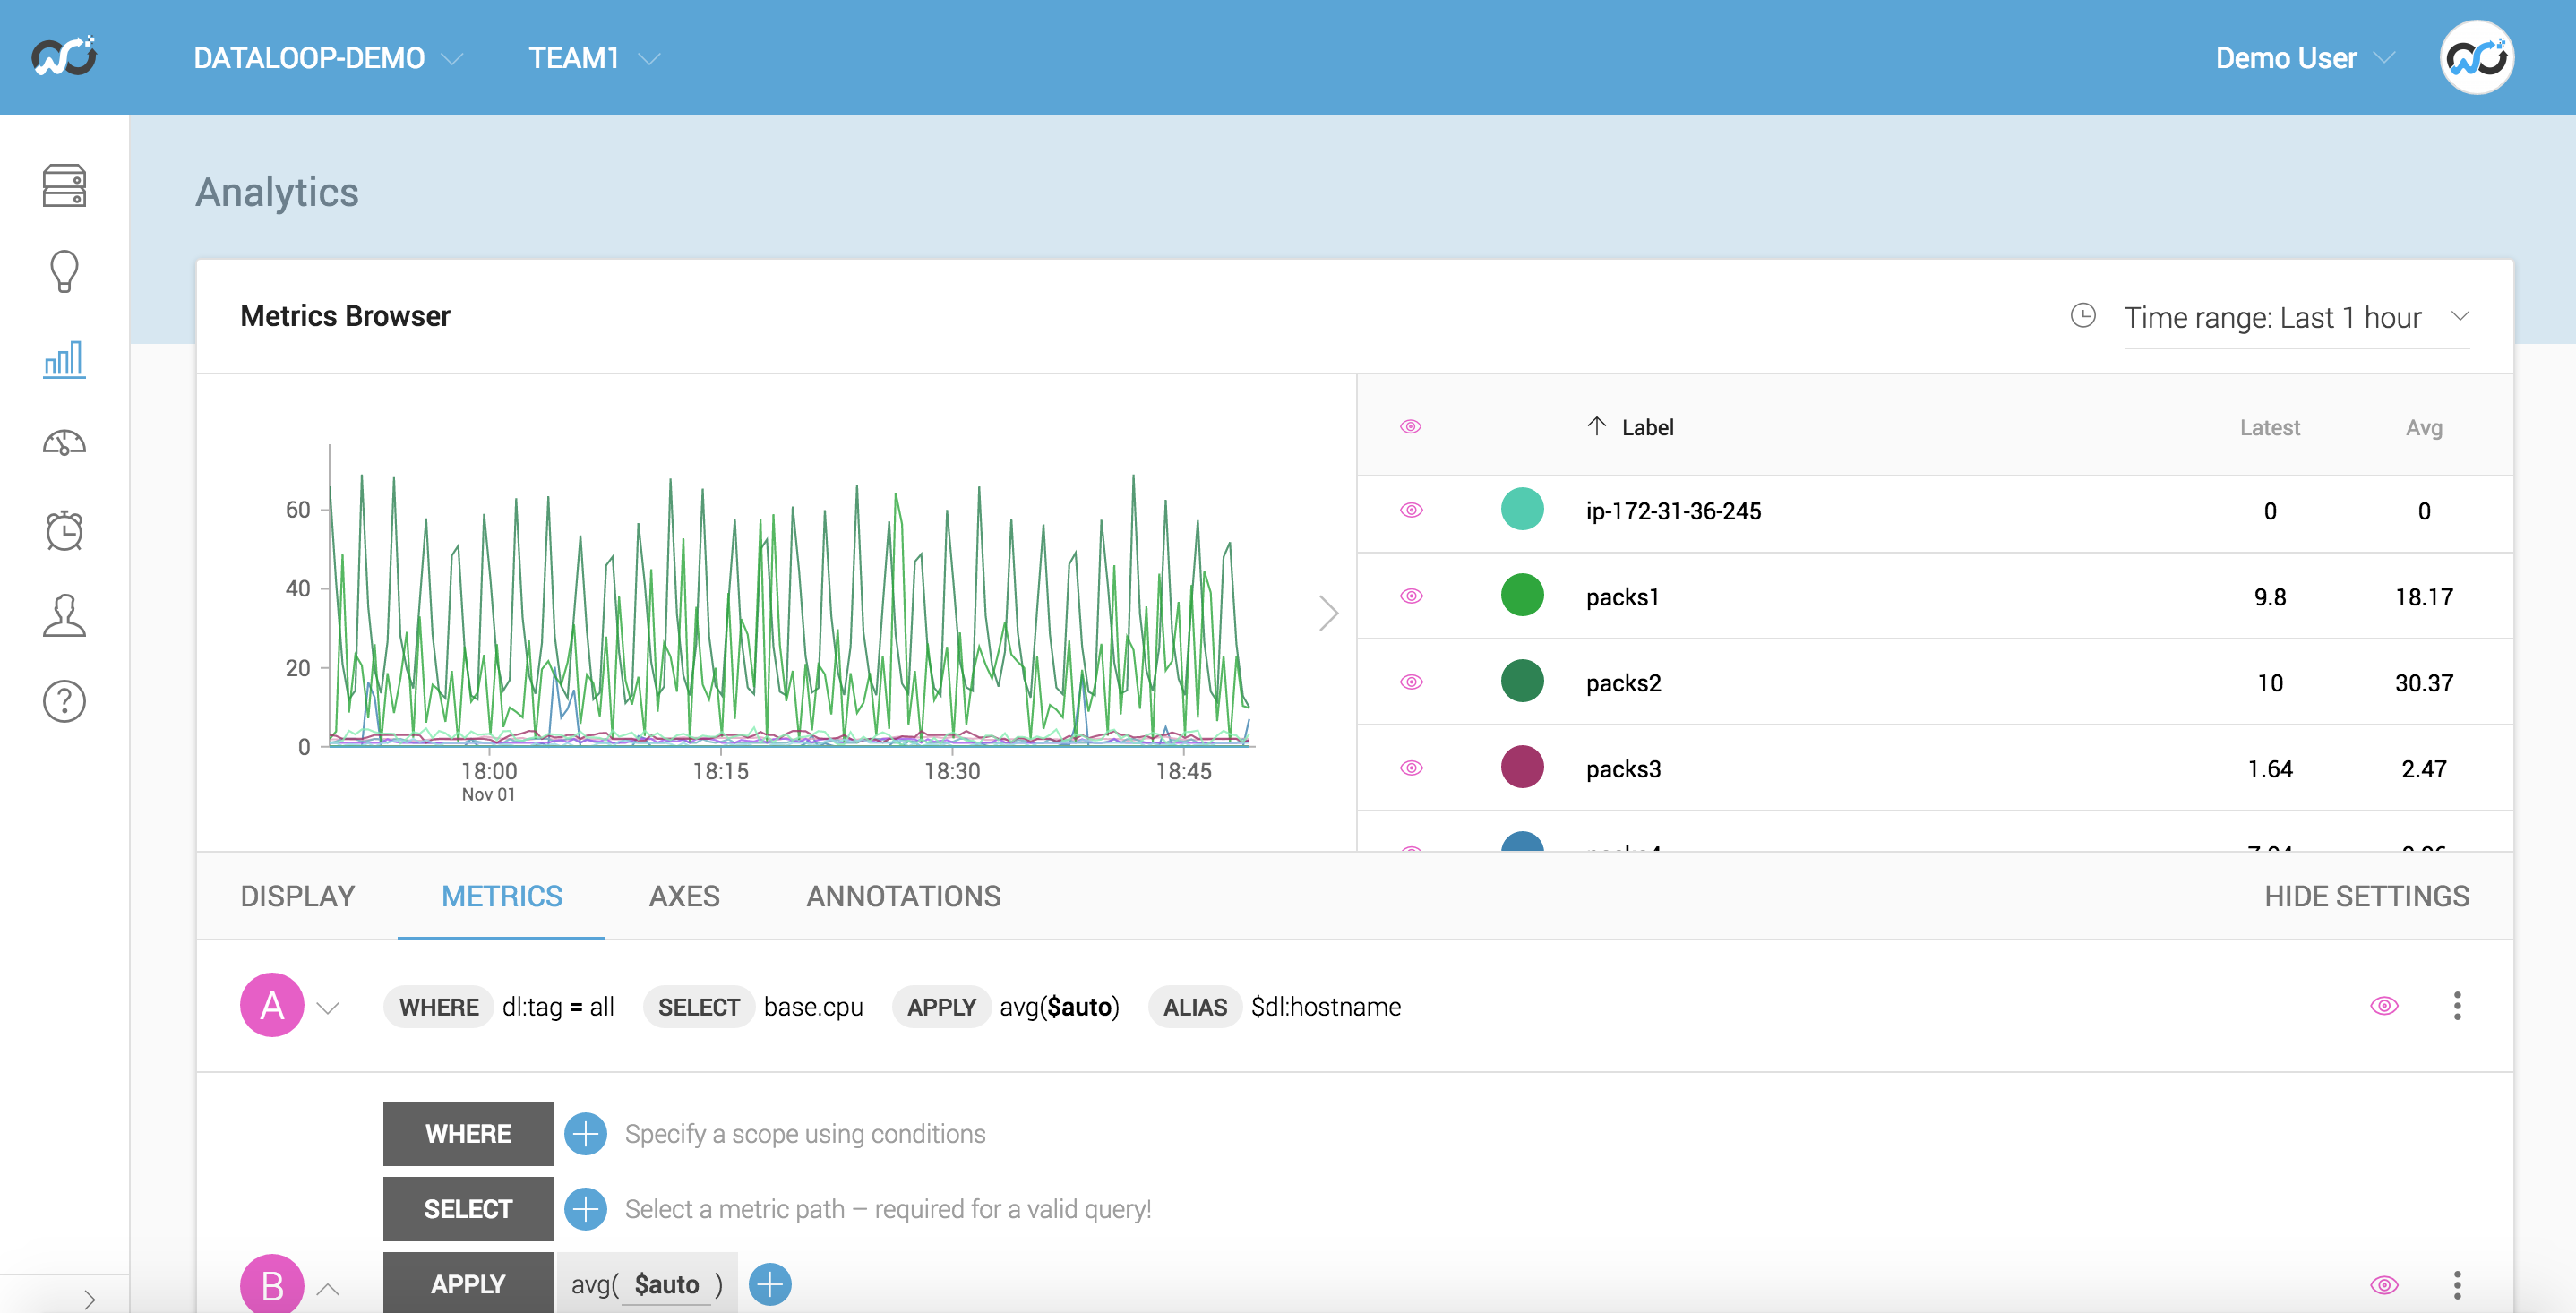
New Features (August, September, October 2016)
Introducing New Features on Metrics Browser, AWS Integration, InfluxDB Metrics
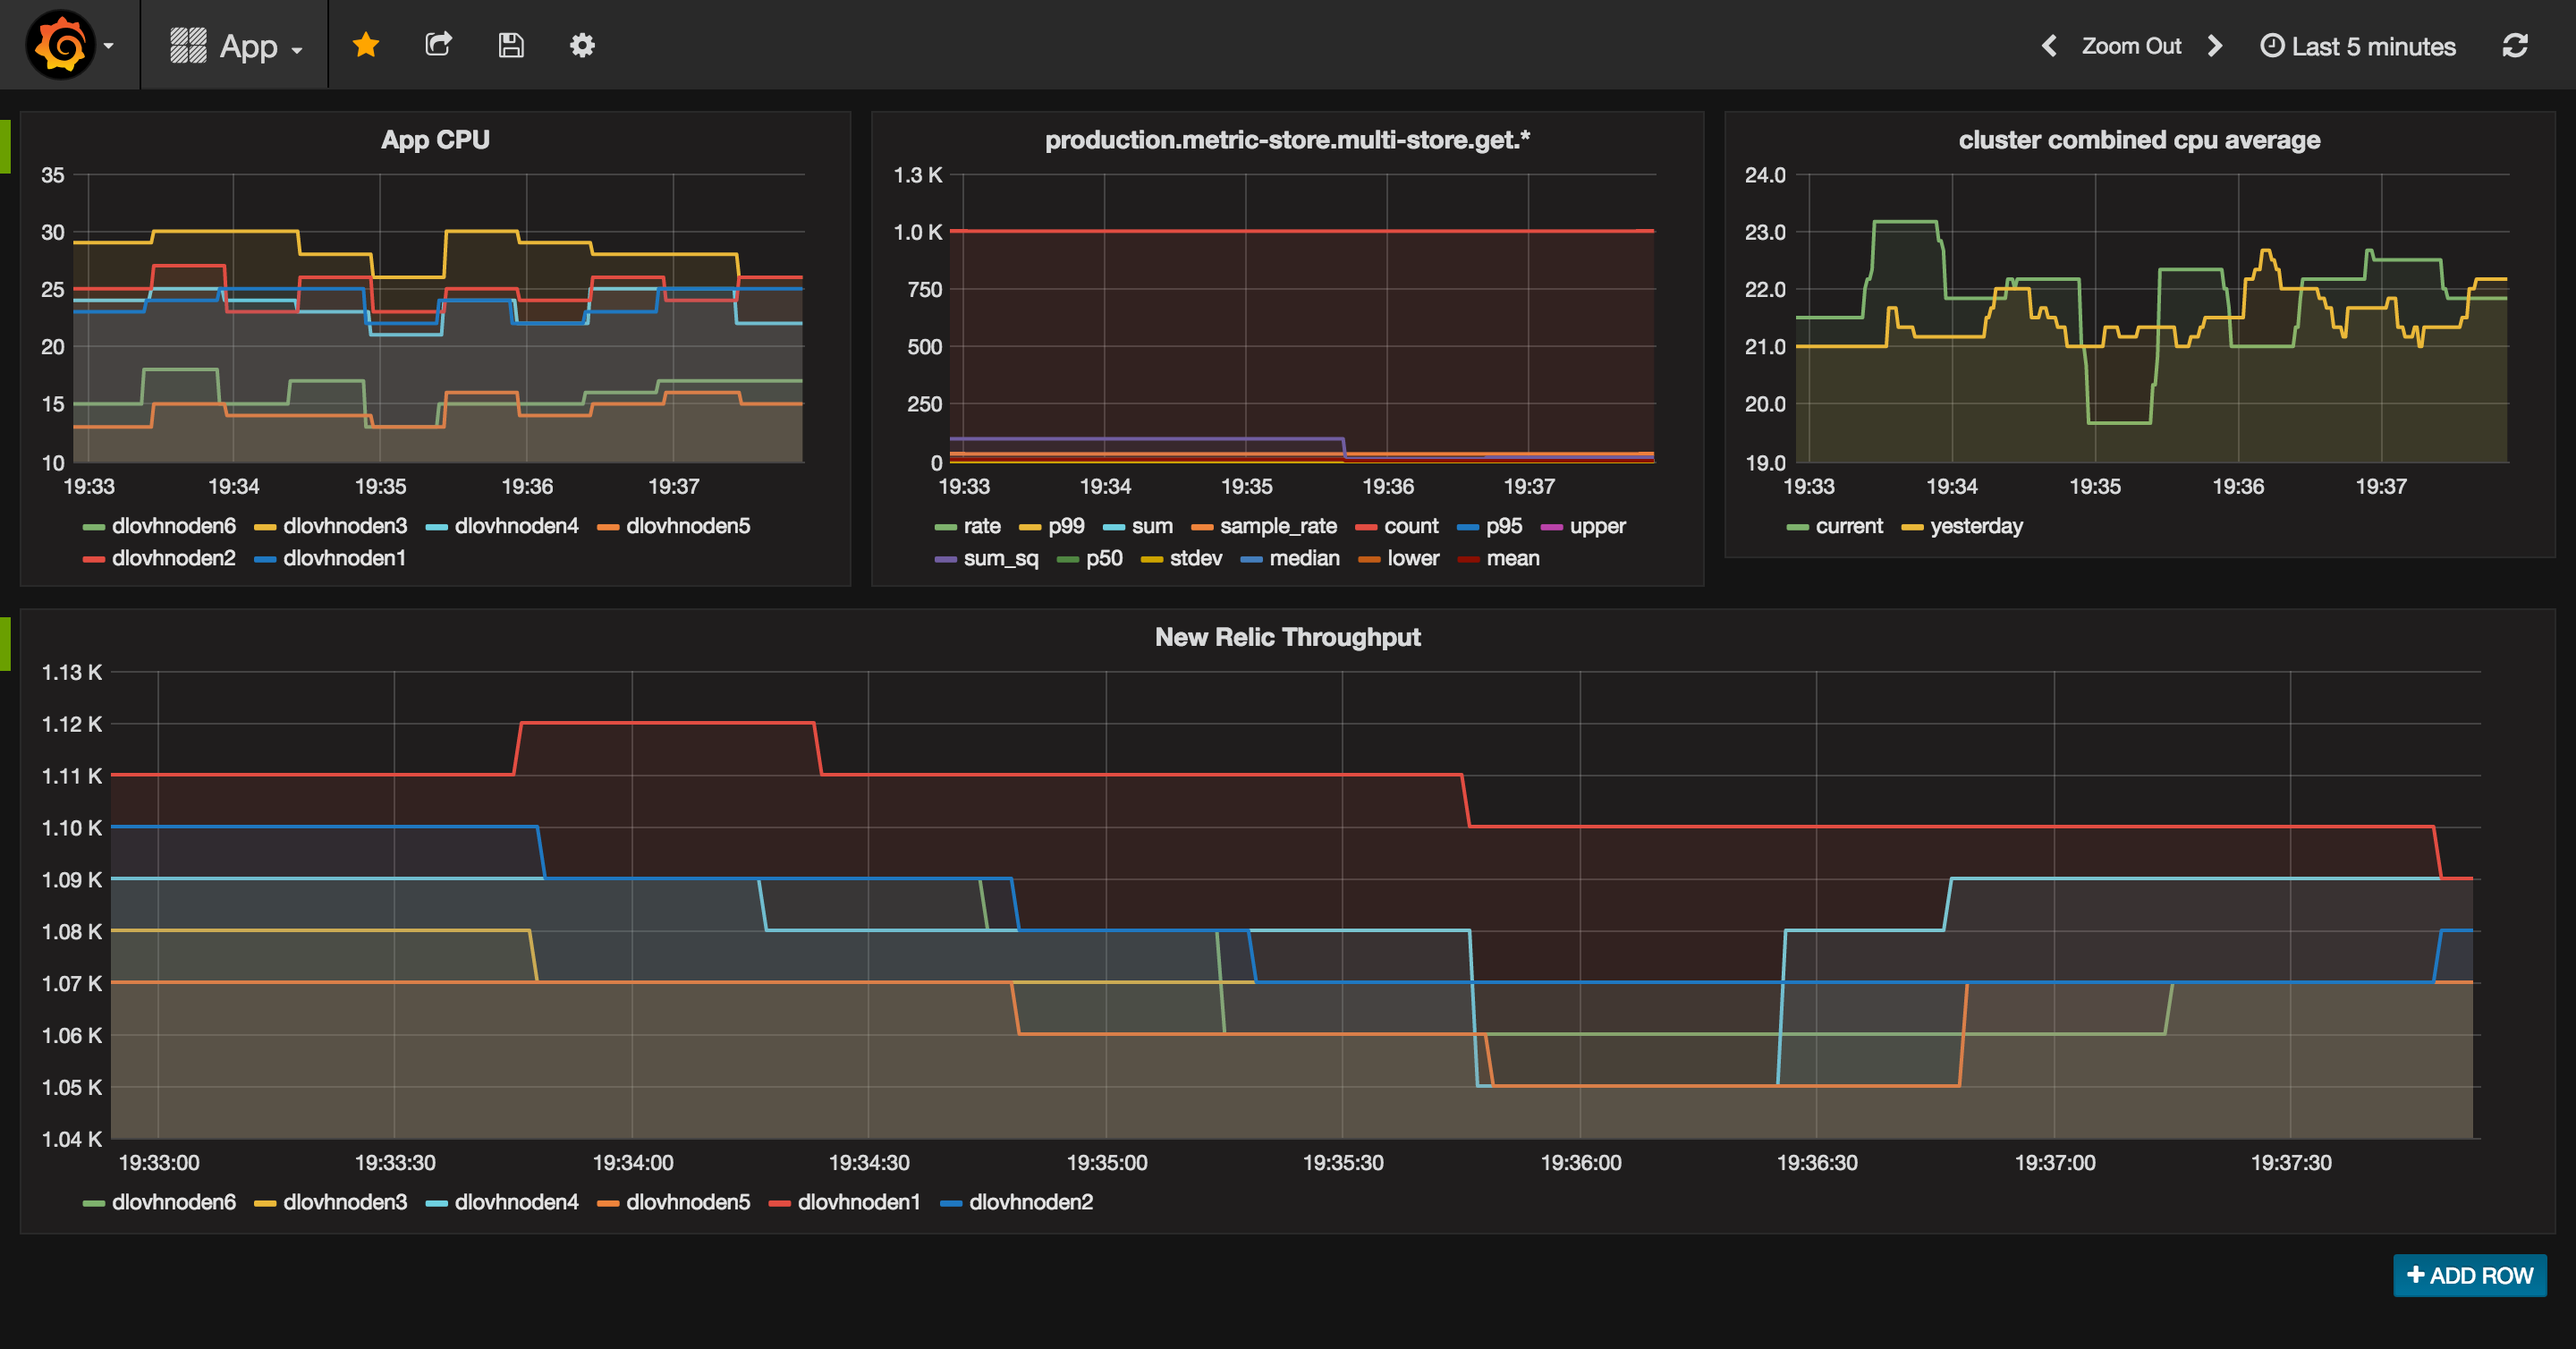
Cool new stuff in the Outlyer Grafana 3.0 plugin
Here's a List of the New Things of Our Grafana 3.0 Plugin
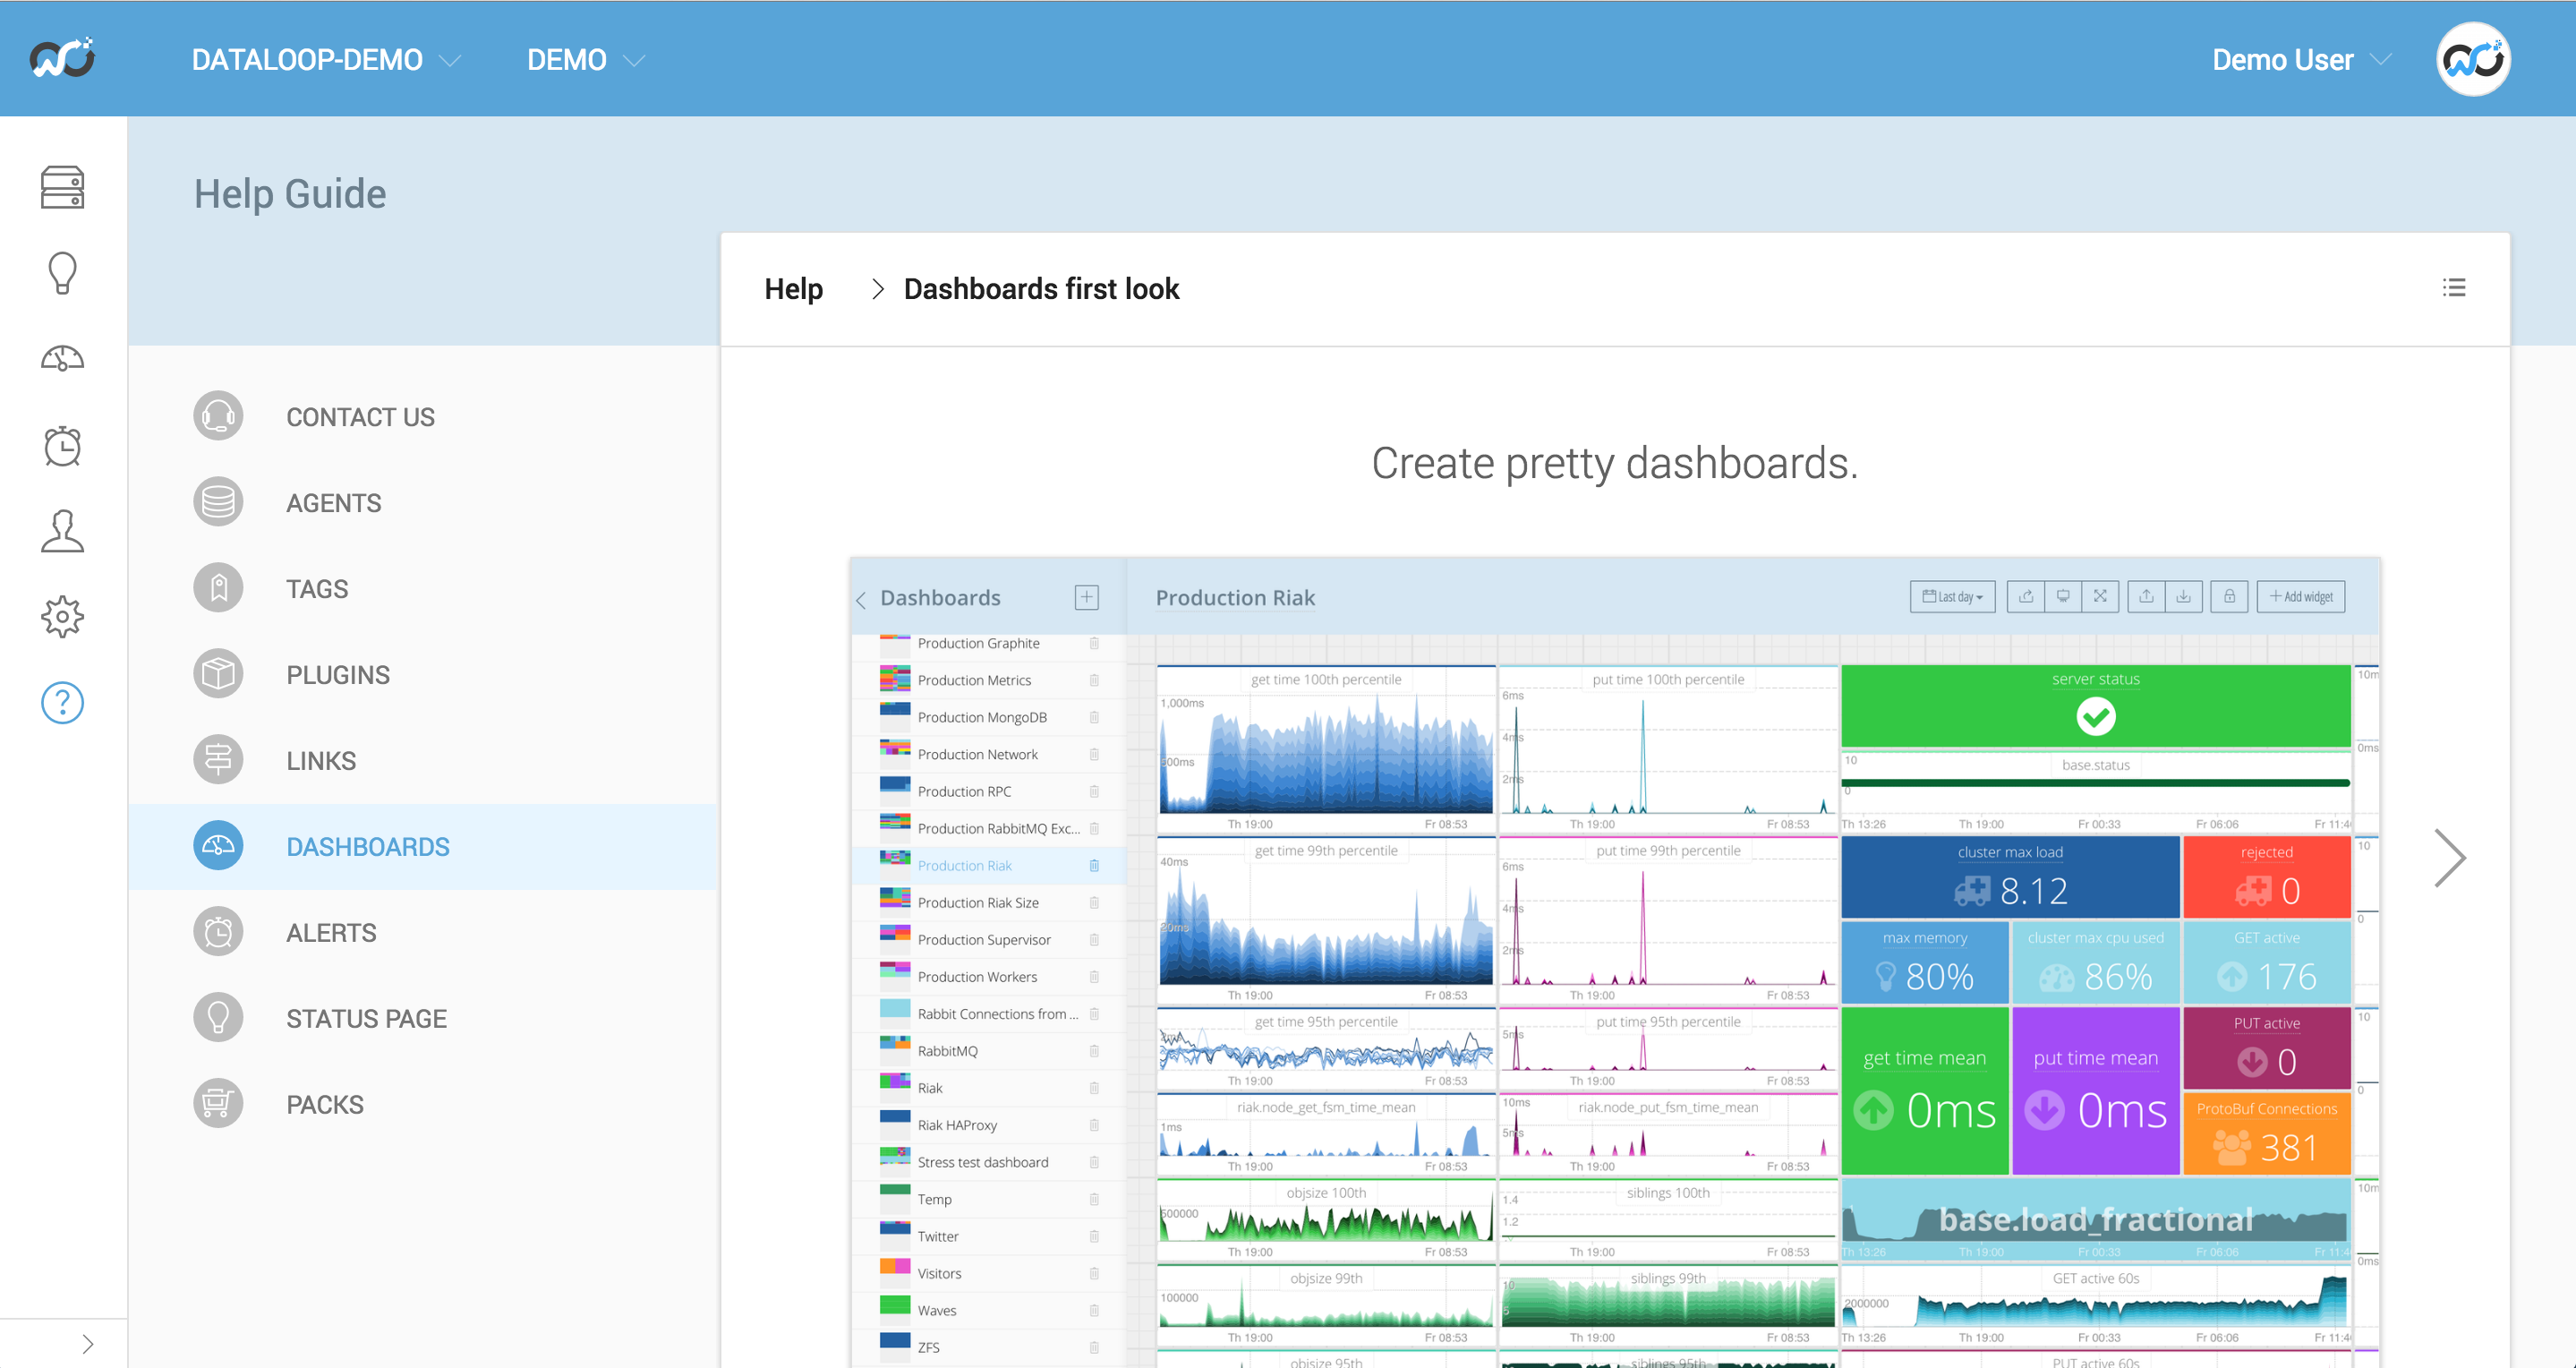

Outlyer now supports Prometheus metrics
We've Extended Outlyer to Support the Rich Metric Format by Prometheus Exporters

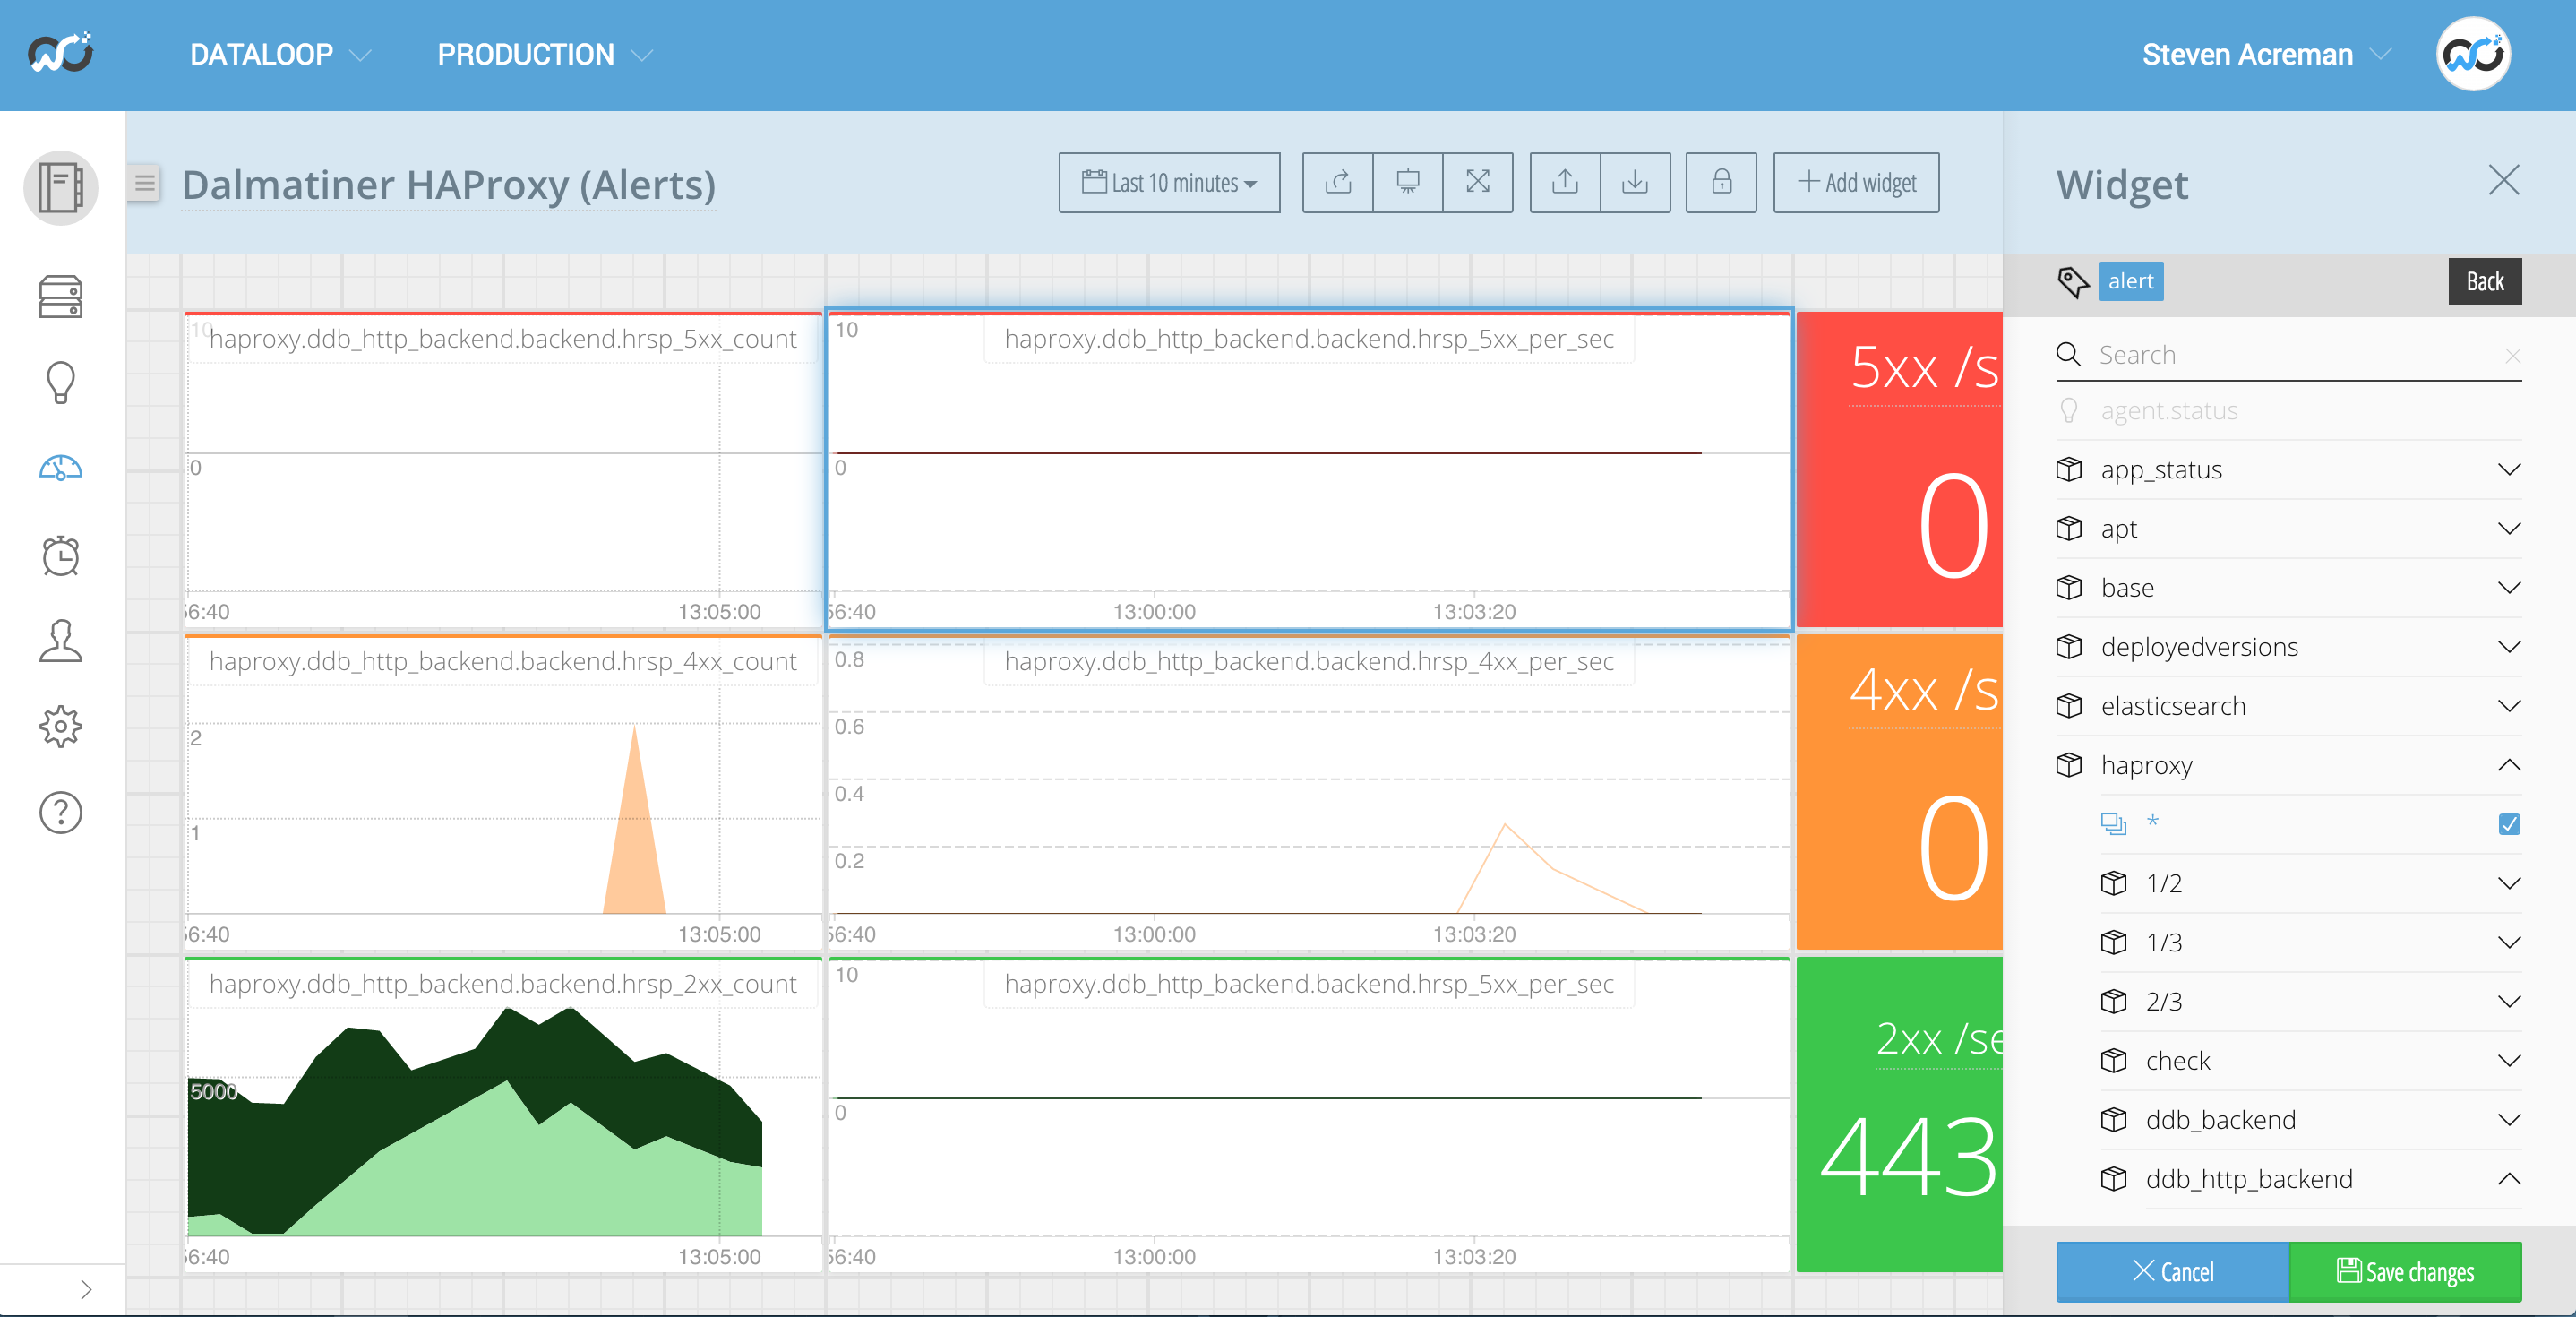
New Features (May 2016)
Lots of updates in May including alerts system, auto discovery and more
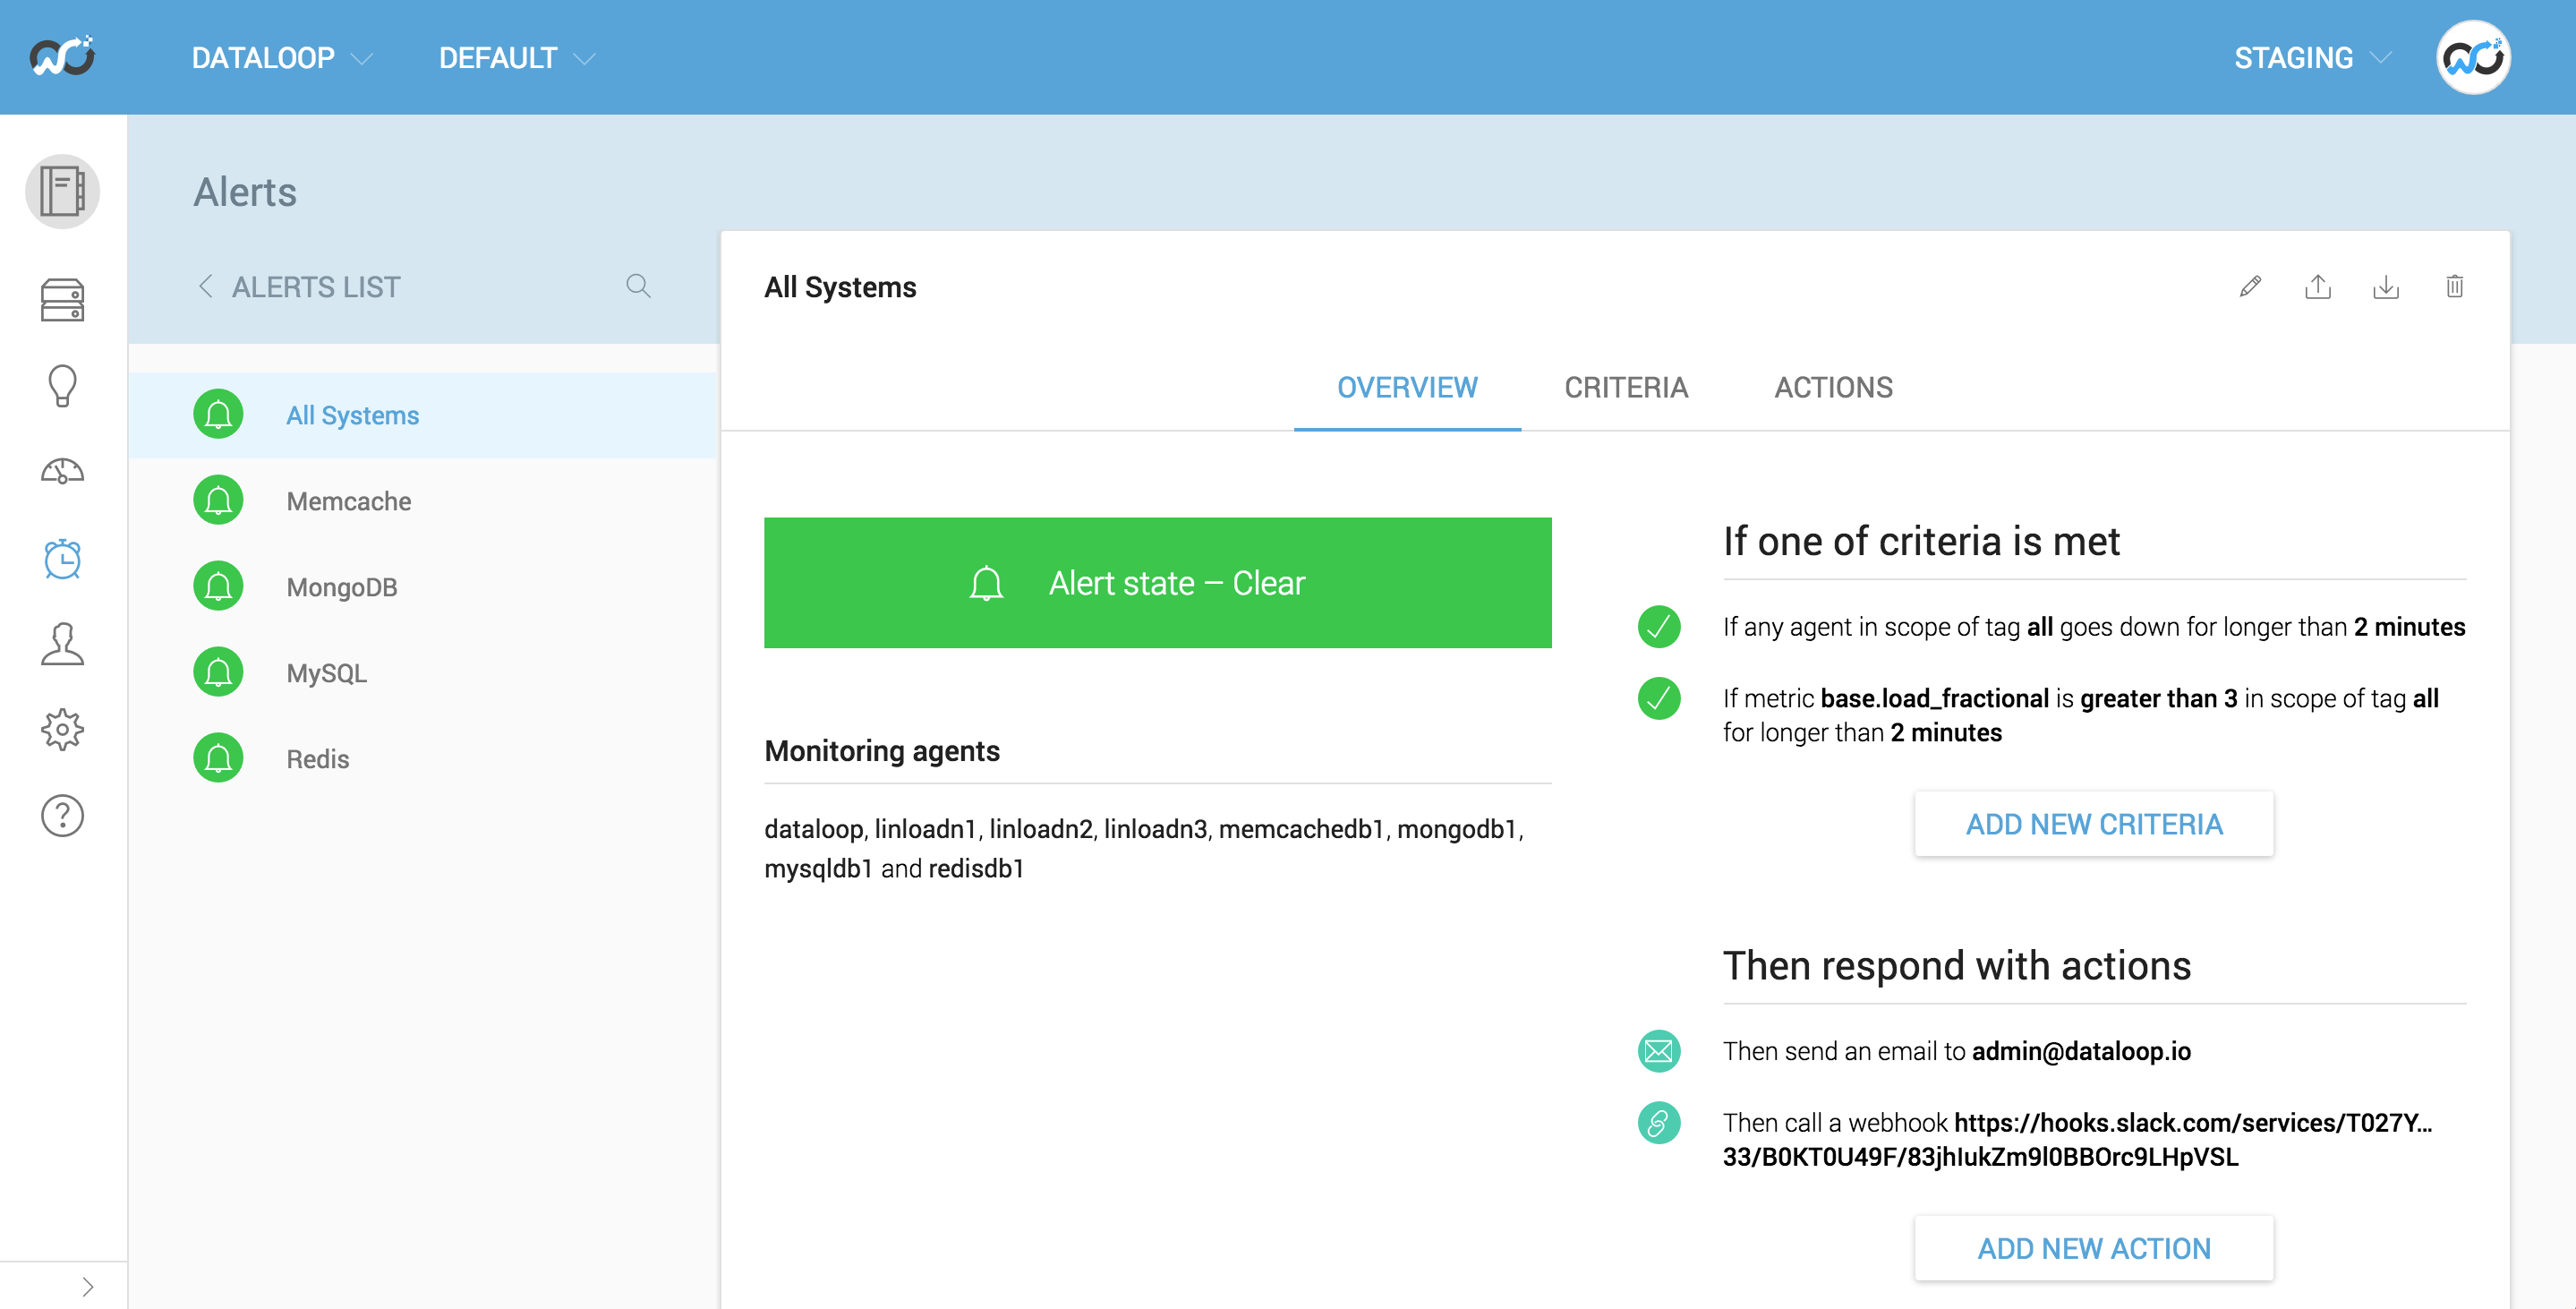

Package Management for Monitoring
Now You Can Get From No Monitoring to a Base Coverage in A Matter of Minutes.
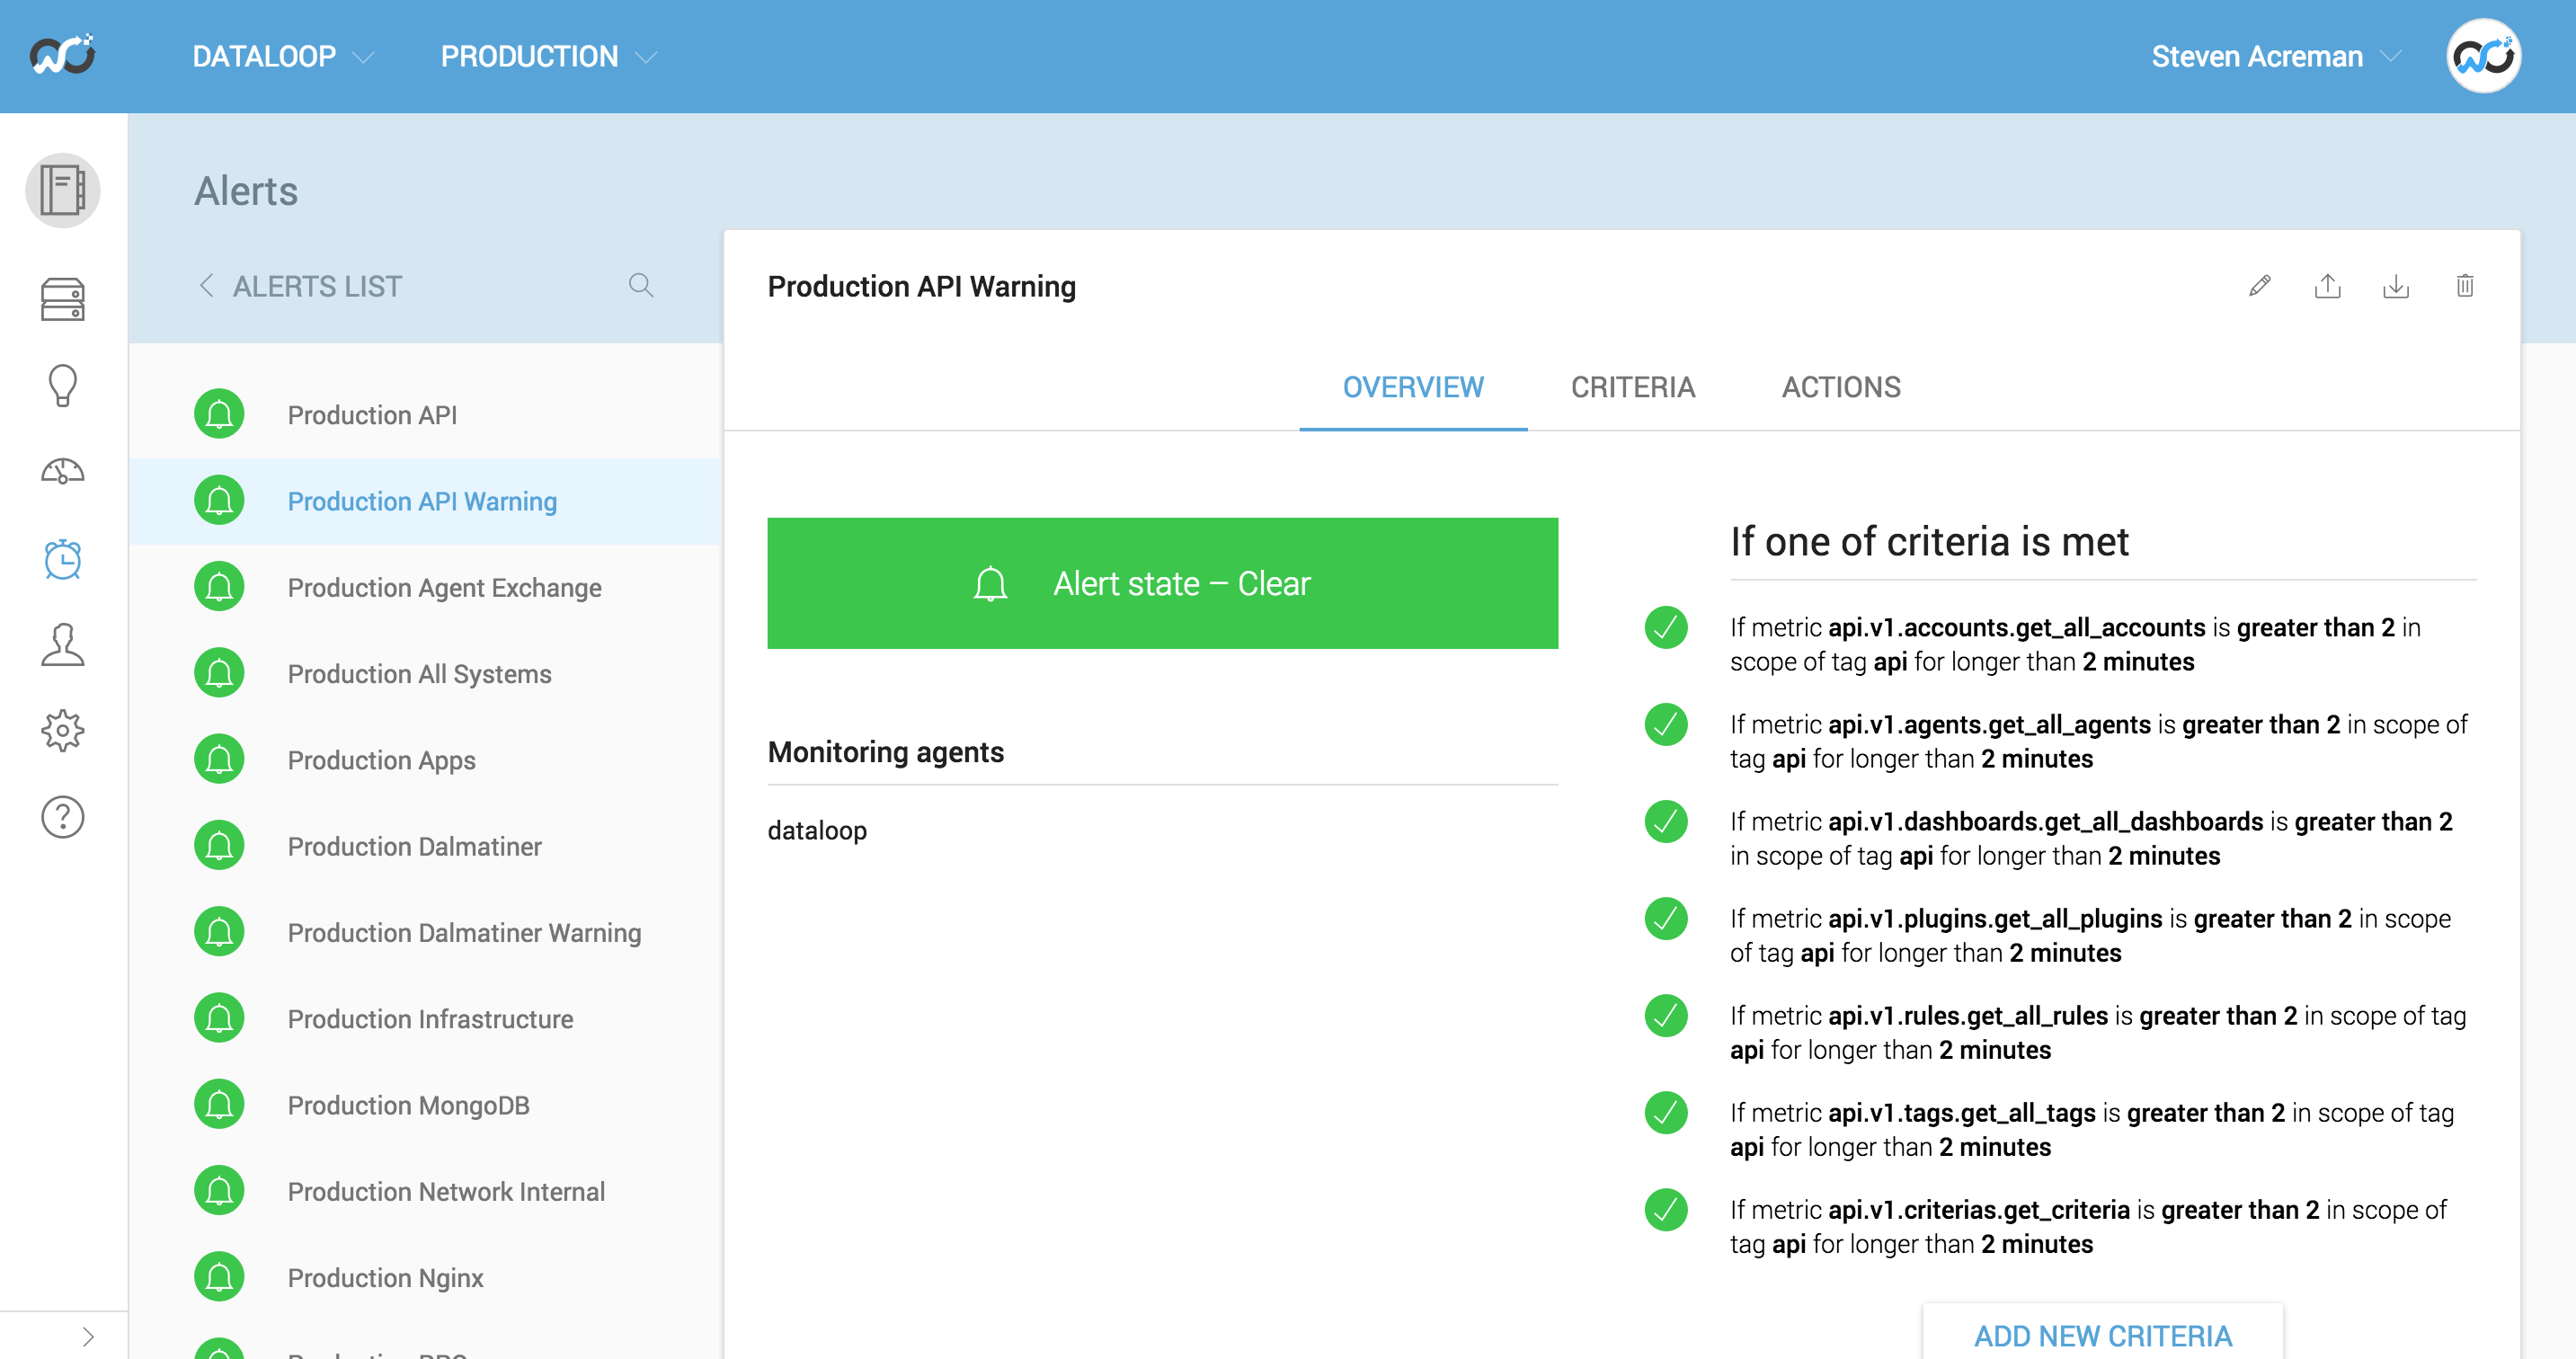
New Features (April 2016)
Product updates from April 2016 including new alerts, widgets and Docker improvements
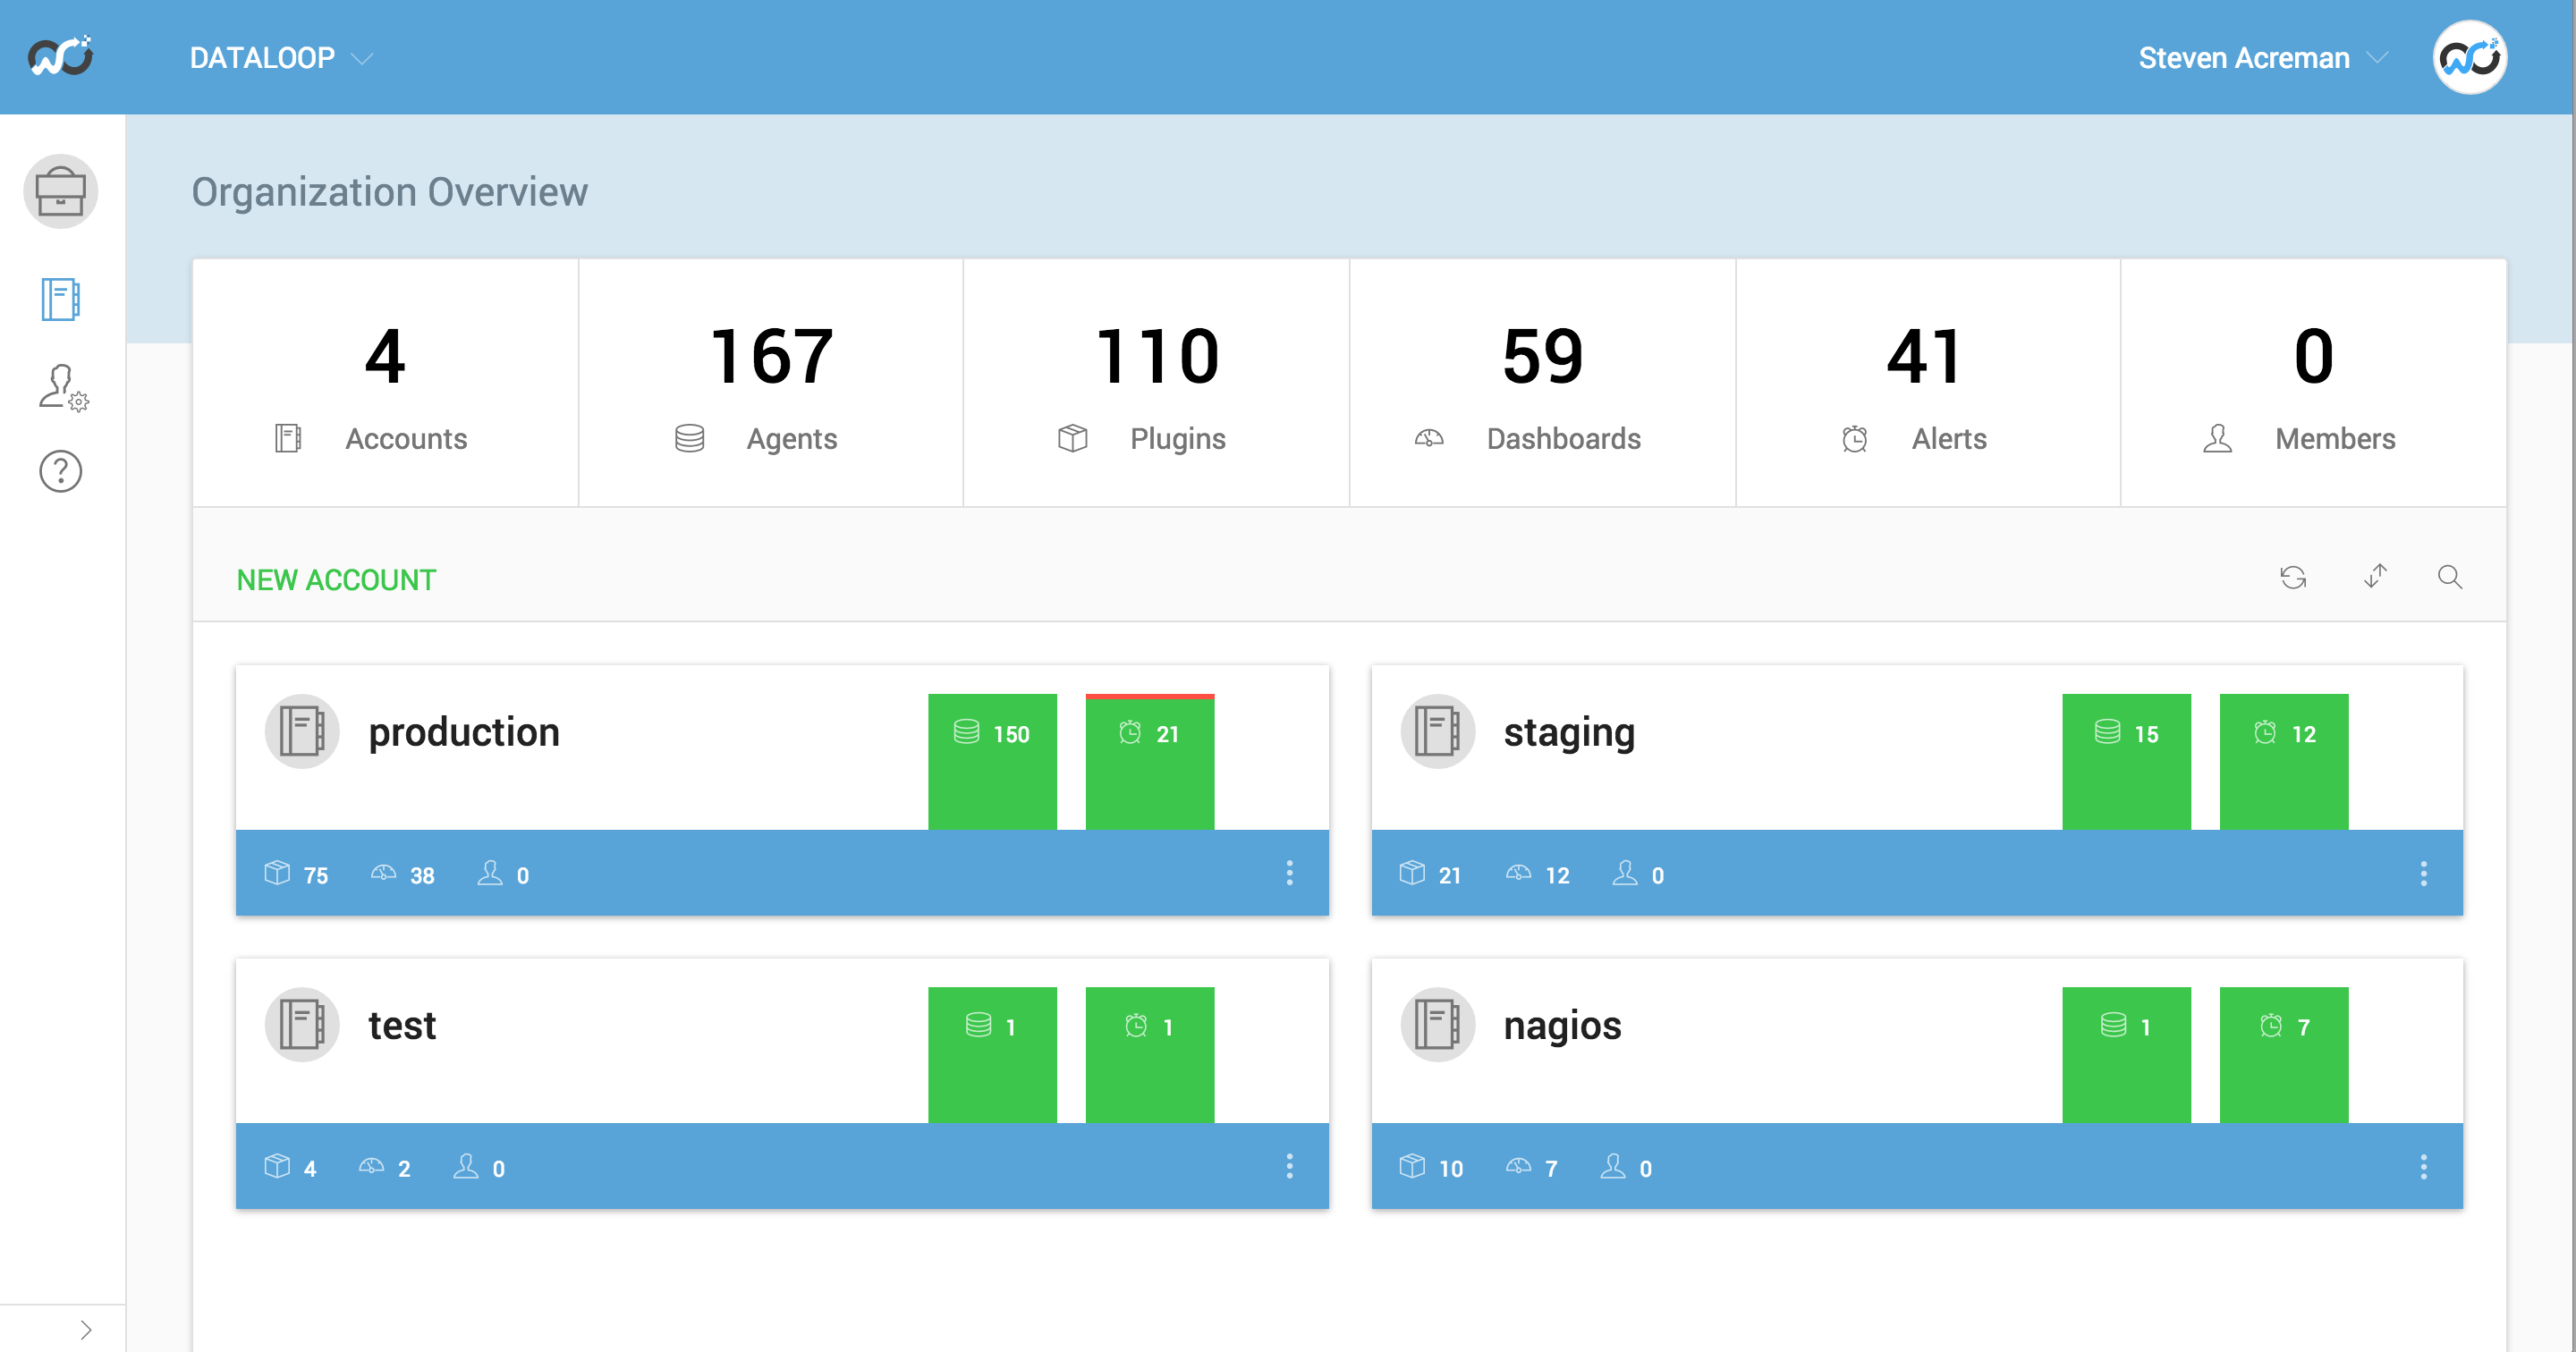
New Features (Jan, Feb & March 2016)
This blog is a round up of the new product updates in case you missed the updates in Slack
StatsD, Outlyer and Grafana
Today We Are Announcing The Release of Our Grafana Datasource Plugin
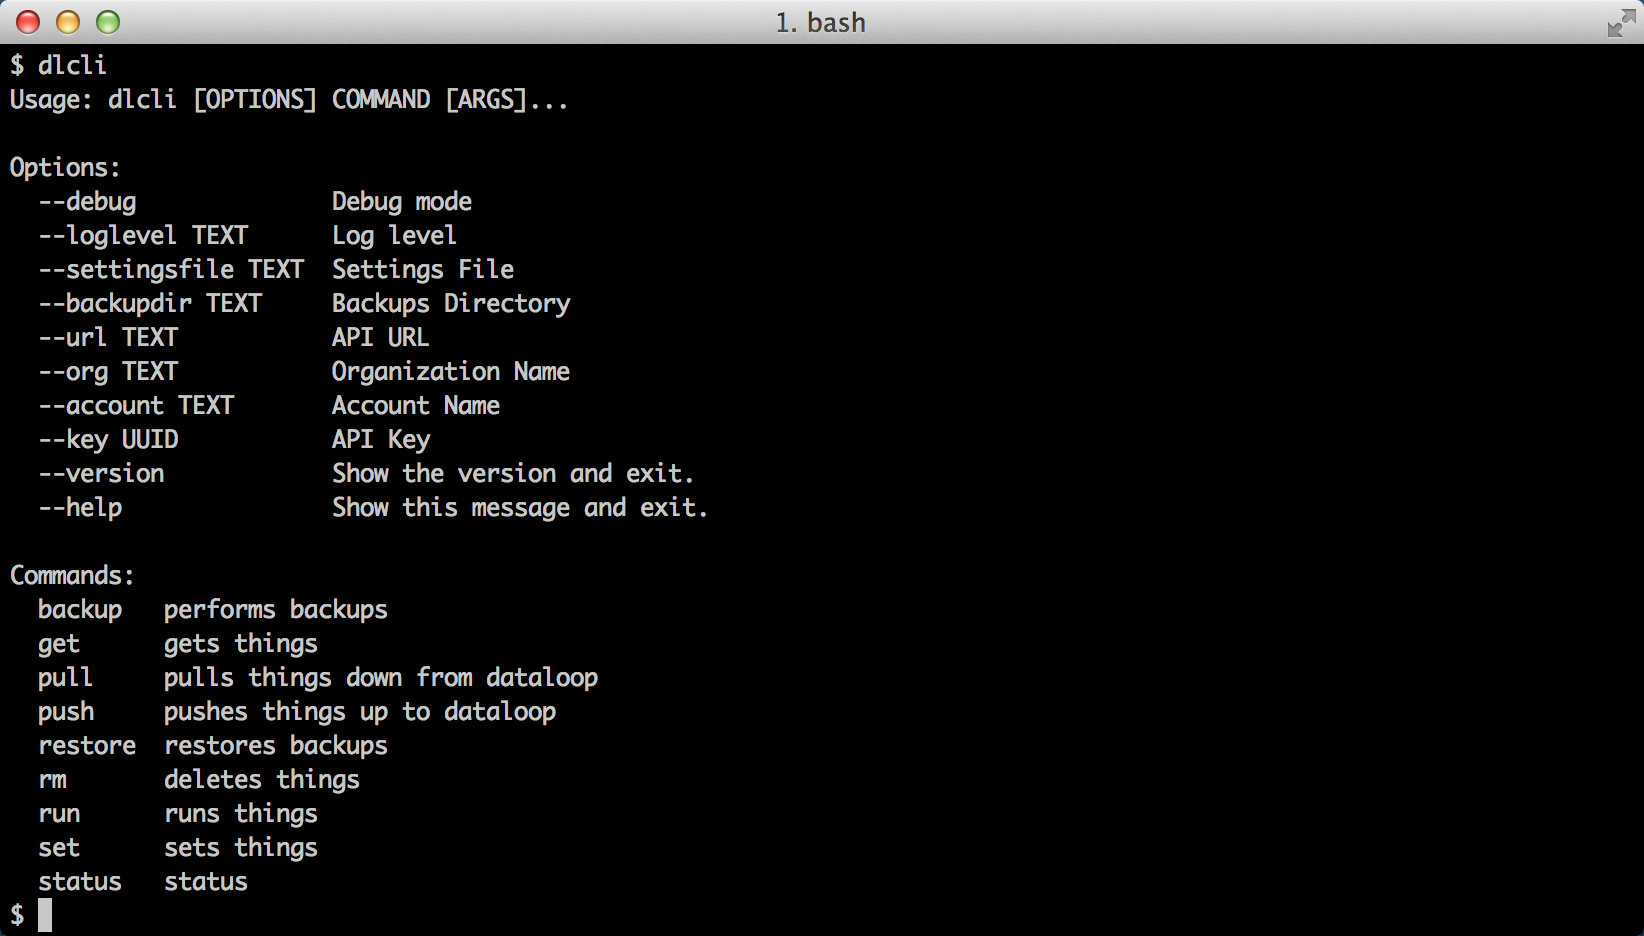
Monitoring Orchestration
Announcing the release of our command line tool for Outlyer, DLCLI

Tying it all together: Monitoring Auto discovery!
A Quick Post About How Auto Discovery Will Work Behind The Scenes
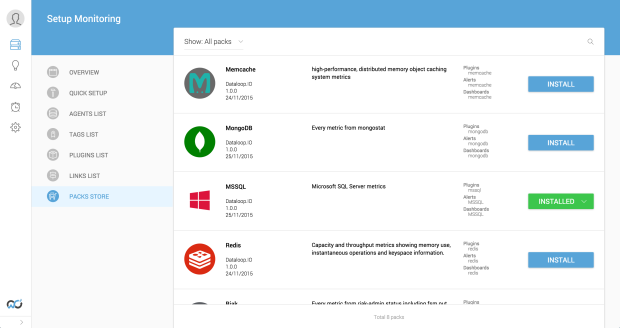
New Feature: Hosted Docker Containers
As of this week, all accounts will get provisioned with their own docker container!

Why We Chose Outlyer for Hive Home - Grant Smith
Grant Smith shares why he chose Outlyer to monitor Hive Home

New Feature: JSON Format Check Scripts
Write JSON output plugins to display tabular data in Outlyer
