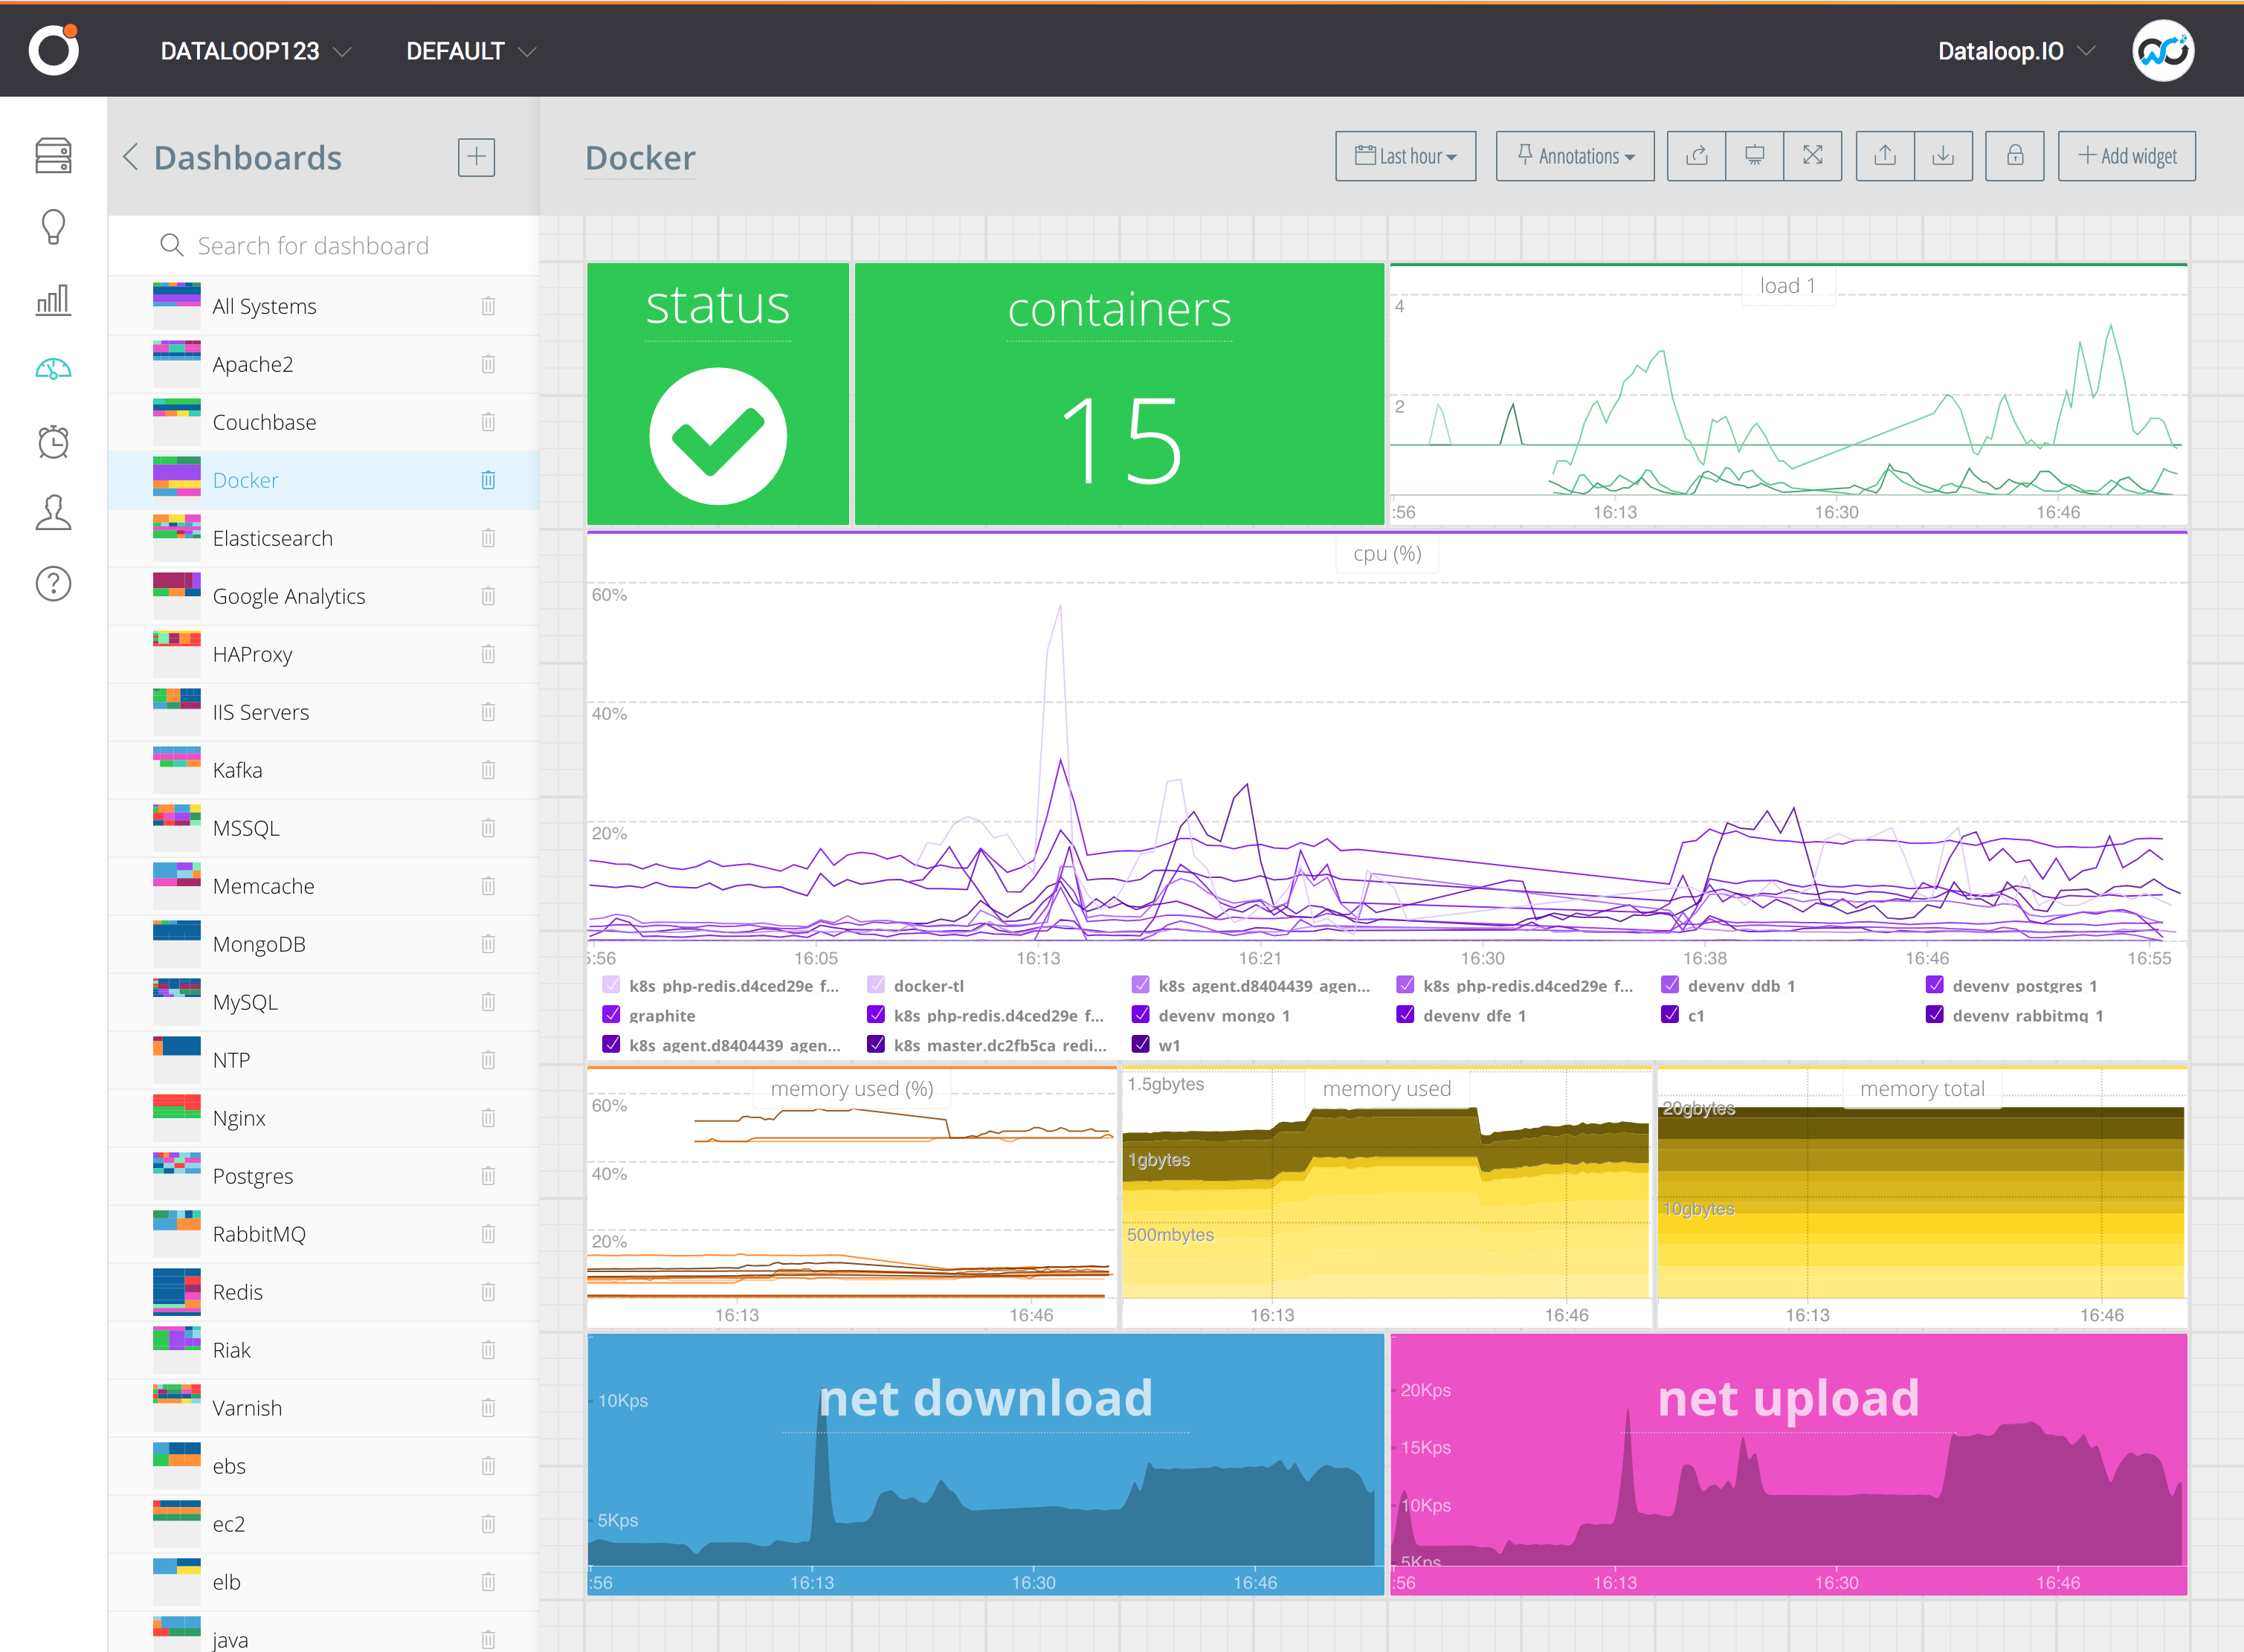
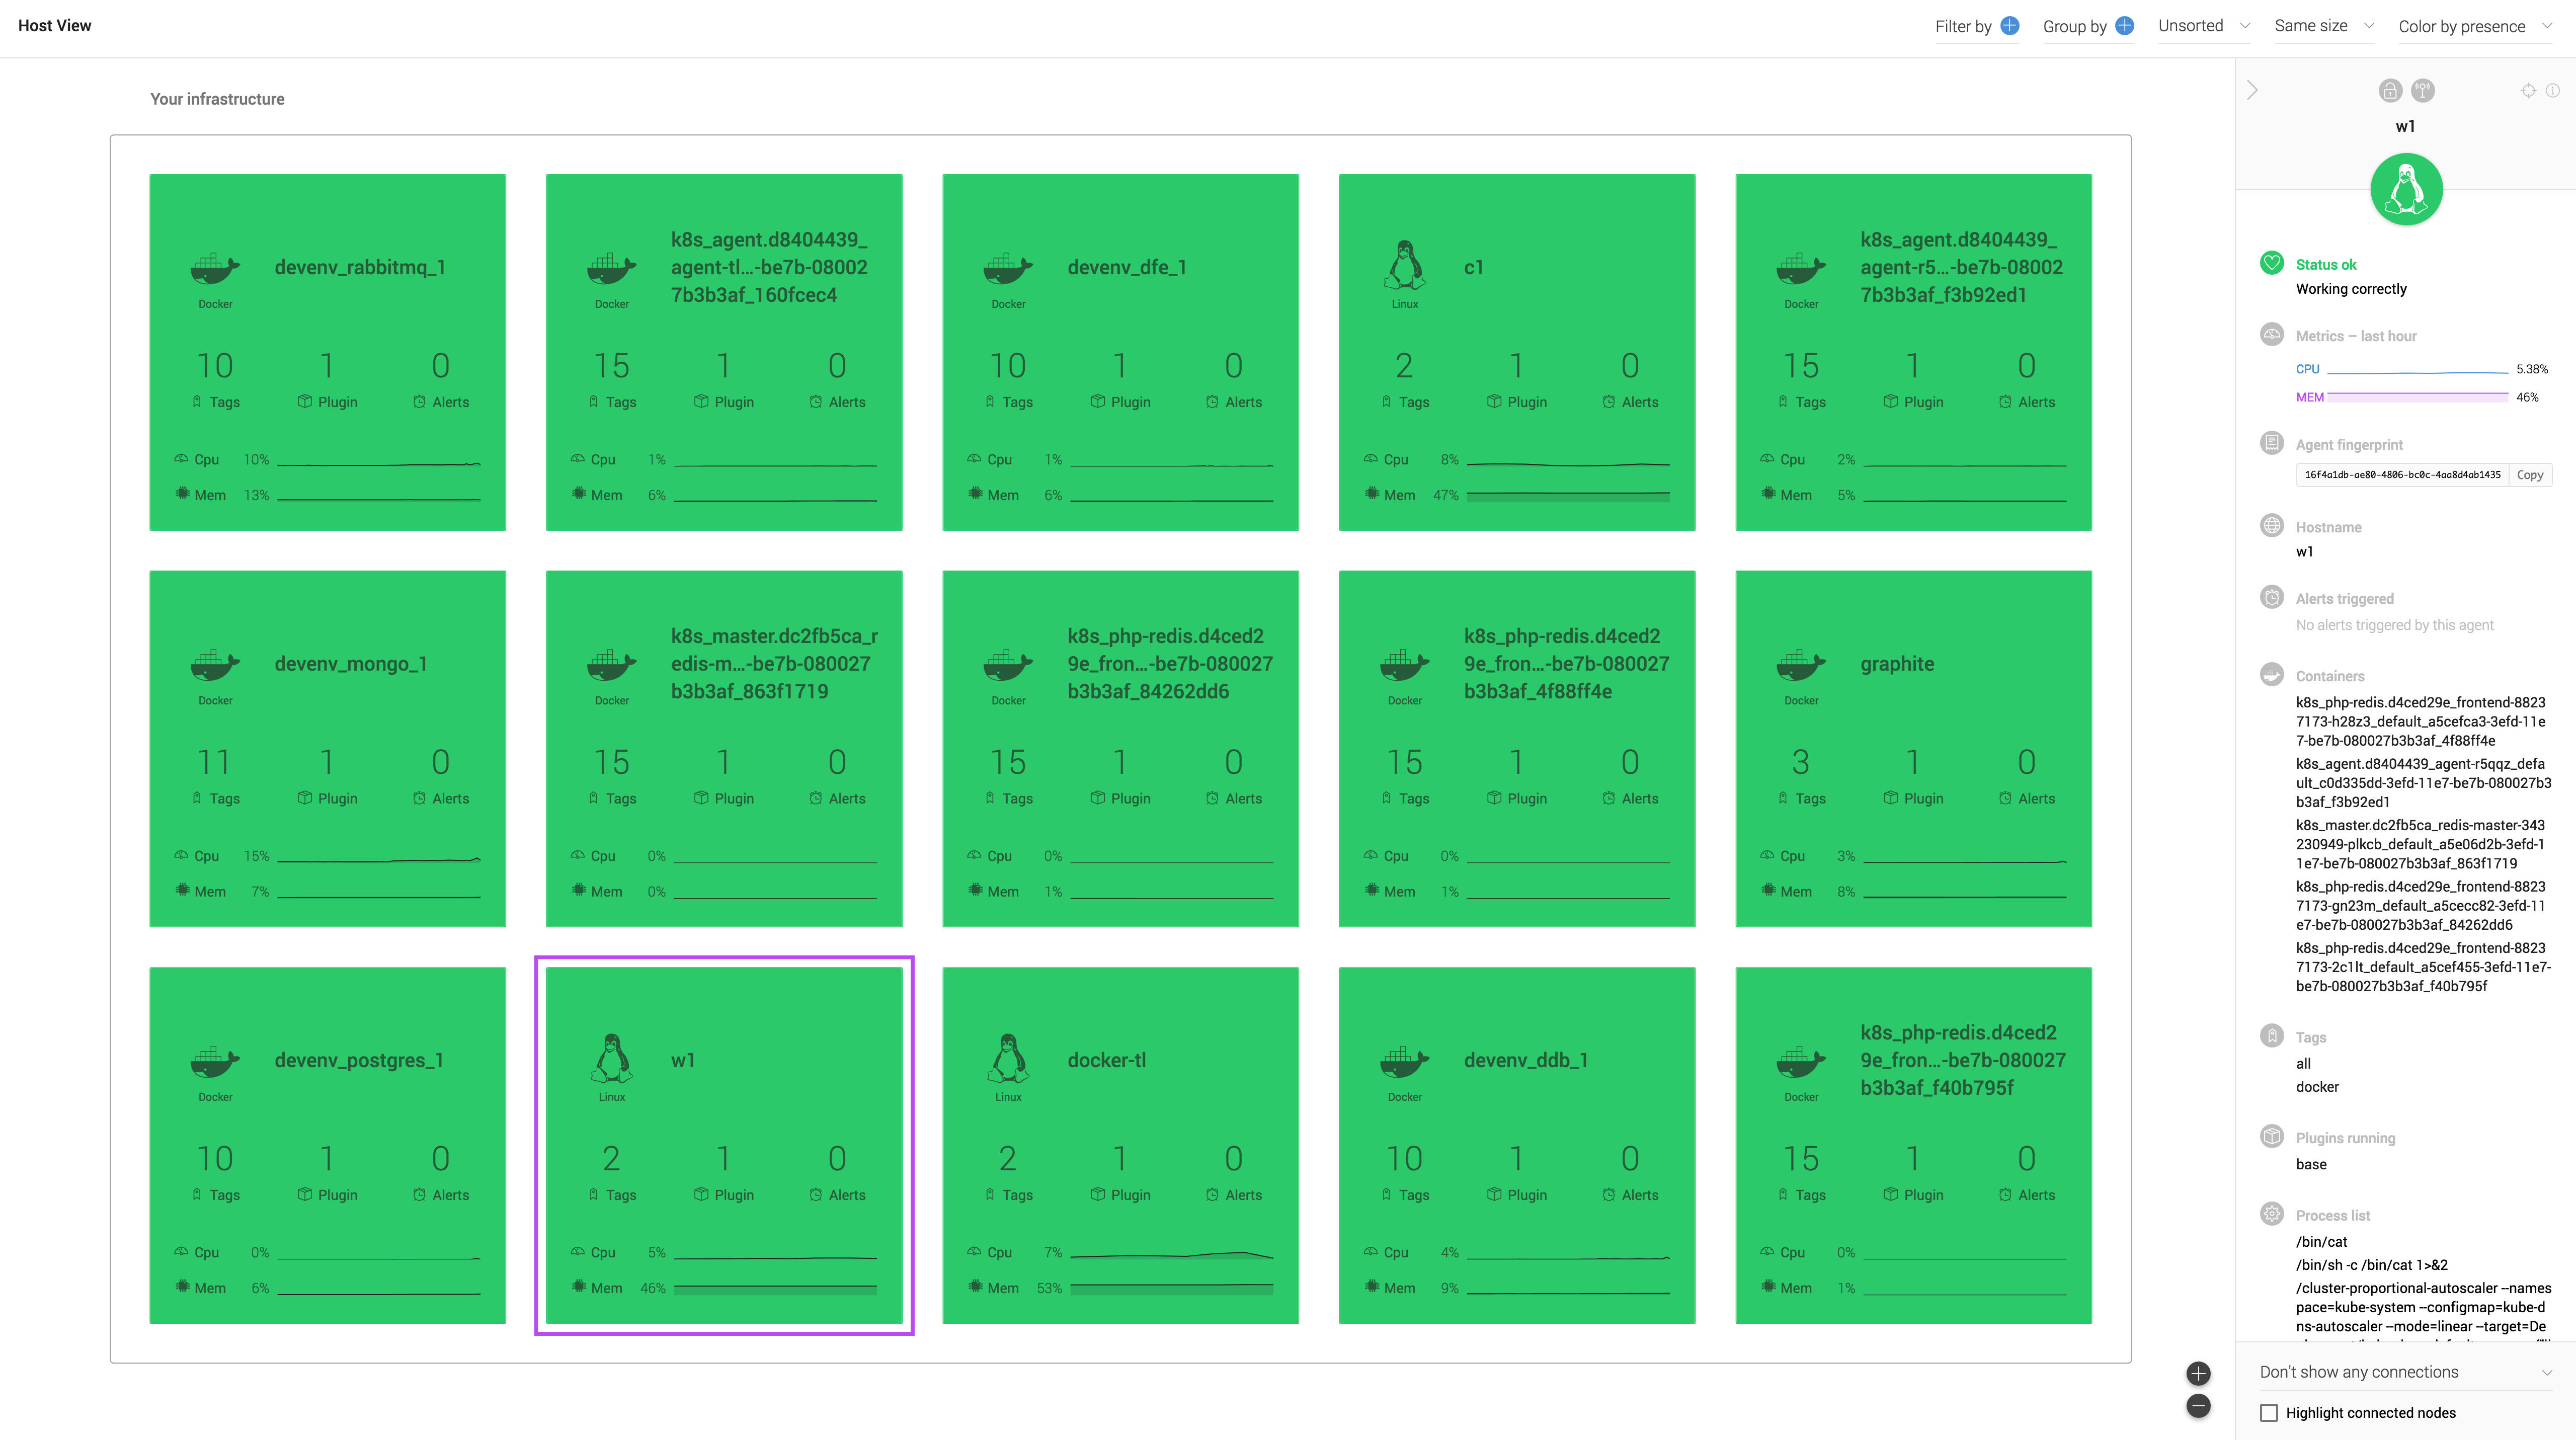
This blog post is a retrospective on how Outlyer built a specific part of its Docker monitoring solution: the container’s metrics collection.
Phase 1: Quick and Hacky Easy: cAdvisor
Outlyer’s very first implementation to get metrics from Docker containers was based on Google’s cAdvisor.
At that time, Docker was getting increasingly popular and some of our customers started to ask for a better solution to visualize the data from their Docker containers inside Outlyer. We needed to deliver a solution in a short amount of time that would be reliable and easy to setup for our users.
At first, cAdvisor appeared to tick all of the boxes.

Getting Docker statistics from your containers with cAdvisor is very easy. The only thing to do is deploy and run a cAdvisor container on all your Docker hosts.
Out of the box it will collect, process and even display your container metrics through a basic web interface. You can watch your containers’ performance in real-time.
The best part for us is that it would expose all the collected metrics through a REST API.
Our solution was then as simple as packaging a container running cAdvisor along with some code that would collect the data from the cAdvisor API at regular intervals. We simply forward that data to our graphite endpoint. Problem solved!
Well no, not really.
While this solution seemed effective at first, we quickly realized that it was far from ideal. Some of our customers started to report that our container would use way too much memory on their system, or even worse; cAdvisor would start crashing after a while. We decided to change how we would pull cAdvisor data. One solution was to use the Prometheus plugin format since cAdvisor also exposes container statistics as Prometheus metrics. Unfortunately that didn’t fix the problem and to top it all off, we started to find that cAdvisor was very hard to debug. We also knew it would be difficult to customize later on.
Being unable to control what kind of container metrics we would grab was not a good solution for the long term. It was time to look elsewhere.
Phase 2: Down the Cgroups Rabbit Hole
Between cAdvisor and Cgroups we briefly considered using the Docker stats api. However, the constant changes and lack of support in older Docker versions meant that our prototype didn’t even make it to production
Under the hood, Docker uses a feature from the Linux kernel called Control groups, or Cgroups, to allocate and track system resources for containers (like cpu, memory and block IO). Cgroups use a pseudo-filesystem to expose these metrics, making them available to collect.
So how do we do that? Let me explain.
- Locating the Cgroups pseudo-filesystem
One thing you will notice if you run our Docker container on your hosts is that we ask you to mount the /proc directory of the host inside our container.
The reason for this is one of the first things we need to do is look into /proc/mounts to locate the Cgroups pseudo-filesystem mountpoint (generally you
will find it under /sys/fs/cgroup, but some operating systems do differ).
bash-4.3# grep cgroup /rootfs/proc/mounts
cpuset /rootfs/sys/fs/cgroup/cpuset cgroup ro,nosuid,nodev,noexec,relatime,cpuset 0 0
cpu /rootfs/sys/fs/cgroup/cpu cgroup ro,nosuid,nodev,noexec,relatime,cpu 0 0
cpuacct /rootfs/sys/fs/cgroup/cpuacct cgroup ro,nosuid,nodev,noexec,relatime,cpuacct 0 0
blkio /rootfs/sys/fs/cgroup/blkio cgroup ro,nosuid,nodev,noexec,relatime,blkio 0 0
memory /rootfs/sys/fs/cgroup/memory cgroup ro,nosuid,nodev,noexec,relatime,memory 0 0
- Locating the containers’ pseudo-files containing statistics
Next, for a given container process id, we read /proc/<pid>/cgroup. Here, we find a path relative to the Cgroup mountpoint for
each Cgroup subsystem: cpu, memory, block IO, etc.
For example: /memory/docker/<container_id>.
Putting it all together, to get container metrics related to say memory, we will look under /sys/fs/cgroup/memory/docker/<container_id>. In
there we find some files ready to be parsed containing the metrics we are interested in.
As you see, there are quite a few:
bash-4.3# ls /rootfs/sys/fs/cgroup/memory/docker/ea203878f6759a0d41a6532dc840446a5f91020bbbbc1f14fe32a7a56473f54b/
cgroup.clone_children               memory.kmem.slabinfo                memory.memsw.failcnt                memory.stat
cgroup.event_control                memory.kmem.tcp.failcnt             memory.memsw.limit_in_bytes         memory.swappiness
cgroup.procs                        memory.kmem.tcp.limit_in_bytes      memory.memsw.max_usage_in_bytes     memory.usage_in_bytes
memory.failcnt                      memory.kmem.tcp.max_usage_in_bytes  memory.memsw.usage_in_bytes         memory.use_hierarchy
memory.force_empty                  memory.kmem.tcp.usage_in_bytes      memory.move_charge_at_immigrate     notify_on_release
memory.kmem.failcnt                 memory.kmem.usage_in_bytes          memory.oom_control                  tasks
memory.kmem.limit_in_bytes          memory.limit_in_bytes               memory.pressure_level
memory.kmem.max_usage_in_bytes      memory.max_usage_in_bytes           memory.soft_limit_in_bytes
- Looking elsewhere for network statistics
For the metrics related to the configured network interfaces, we read directly from /proc/<pid>/net/dev as shown below:
bash-4.3# cat /rootfs/proc/11303/net/dev
Inter-|   Receive                                                |  Transmit
 face |bytes    packets errs drop fifo frame compressed multicast|bytes    packets errs drop fifo colls carrier compressed
gretap0:     0       0    0    0    0     0          0         0        0       0    0    0    0     0       0         0
    lo:    430       4    0    0    0     0          0         0      430       4    0    0    0     0       0          0
  sit0:      0       0    0    0    0     0          0         0        0       0    0    0    0     0       0          0
ip_vti0:     0       0    0    0    0     0          0         0        0       0    0    0    0     0       0          0
  gre0:      0       0    0    0    0     0          0         0        0       0    0    0    0     0       0          0
ip6tnl0:     0       0    0    0    0     0          0         0        0       0    0    0    0     0       0          0
  eth0: 120087    1175    0    0    0     0          0         0  3993998     747    0    0    0     0       0          0
 tunl0:      0       0    0    0    0     0          0         0        0       0    0    0    0     0       0          0
ip6_vti0:    0       0    0    0    0     0          0         0        0       0    0    0    0     0       0          0
ip6gre0:     0       0    0    0    0     0          0         0        0       0    0    0    0     0       0          0
- Bonus points: Load Average
It’s a little bit more tricky for our container to get the load average for all the other containers running on the host. The way we do it: we use netlink, a socket based interface in Linux, to ask the kernel directly. I won’t be going into too much detail about that here, as this will be covered entirely in a future blog post. One thing to keep in mind though, as stated in our documentation you have to run the container with –net host if you would like load averages for your containers.
Ok, that’s pretty much it now.
As we have seen, messing around with Cgroups, pseudo-files and system call is not as straight forward as spinning up a cAdvisor container. But the advantages are quite significant:
- it removes any third party dependency (unexpected crash, high memory footprint: no more).
- we get full control over the metrics we collect and how we collect them. The list can be found here.
- this solution is not limited to Docker only and it will make it easy to support a new container technology in the future.
The end result:

Conclusion
We can summarize Docker metric collection in two statements:
- Out-of-the-box solutions are easy to setup but you have to take into account their limitations. It is probably not going to be good enough for monitoring a production environment.
- Cgroups on the other hand, seems like the way to go. But building a solution around the lower levels will give you a headache. And that’s where Outlyer comes in.
Deploy our agent directly on your hosts, or within a container.
We also provide template files so you can deploy our container directly in your kubernetes or a Docker Swarm cluster.
You can also run our plugins directly against your container to get custom metrics. But that might be for another post.
