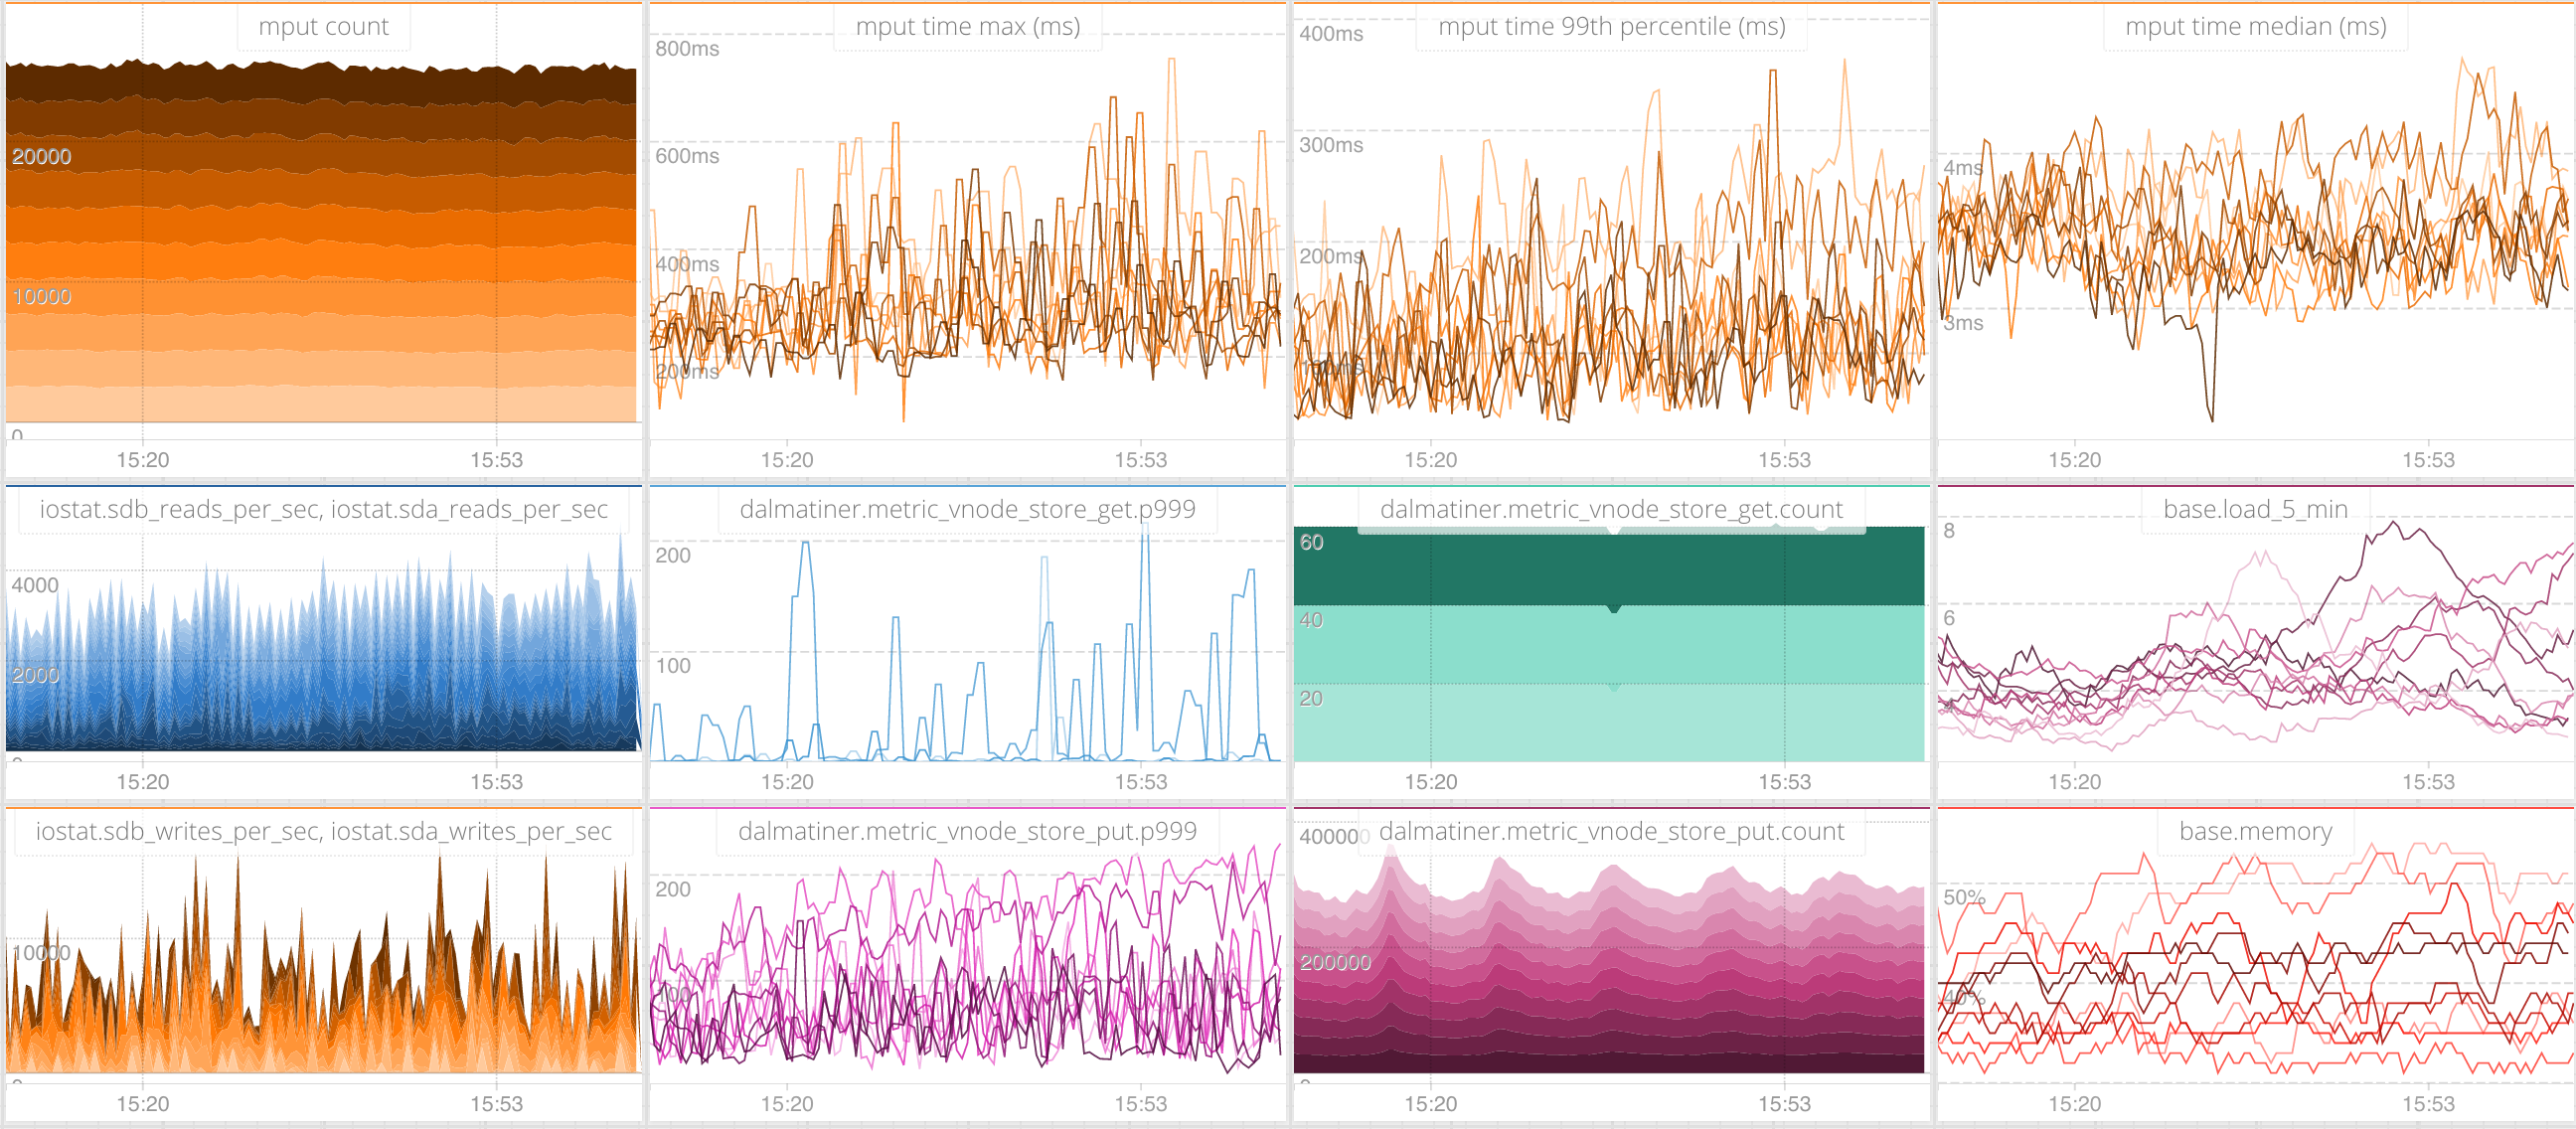
We’ve started to use a new time-series database called Dalmatiner DB which relies on the filesystem for features like compression and consistency checking. Initially this database was written for SmartOS which has native ZFS support but given the maturity of ZFS on Linux we thought we’d run our setup on Linux.
Why we are moving databases is the subject for another blog post. If you are really interested I’ll be presenting at the next Erlang Meetup in London in a couple of weeks.
Summary (tldr;)
Overall a positive experience with no major problems. Performance is good and we’ve not had any data loss. Out of the box ZFS is brilliant but there are lots of settings to tune if you want to dive in.
We should have read a lot more up front but as with most things we jumped straight in and started experimenting.
If there was a moral to our story it was to give ZFS direct access to the disks and to trust it to manage everything.
The Journey
The Riak cluster we were using had grown to a sizeable number of nodes all running SSD’s. We also had various Redis nodes in front acting as a write cache to allow our metrics workers to process the metrics and write at a constant speed to disk.
The goal with this new database was to remove the Redis caching and make the database cluster fast enough that it could accept writes directly.
For everything in this blog the operating system is Ubuntu 12.04 and we make use of a few third party tools like the awesome fio package (apt-get install fio). We are using the ZFS on Linux package from:
http://ppa.launchpad.net/zfs-native/stable/ubuntu
We knew from our current Riak nodes that they did approximately 50k IOPS for writes and that Redis was massively helping with caching.
Our goal was to get to approximately 80k IOPS per node. This was all theoretical so we thought we’d get the cluster setup to run as fast as it could by benchmarking the disks. Then in parallel instrument the new database to get timing values for writing to disk so we could push production load onto it and get some real results.
Our first experiment with ZFS on Linux was with 5 physical servers with 8 cpu cores, 64gb ram, 2 x SSD’s and 2 x 4Tb SATA 7200 spinning disks. These were pretty cheap considering the 8Tb of available storage.
The naive theory was that we could put the OS on the first SSD, use the second SSD as the cache and use ZFS to stripe the SATA disks for data. The output of the ‘zpool status’ command looked like this:

This was wrong due to a lack of understanding of how ZFS operates.
- The SSD cache disk only helps with reads
- The write cache is the ZIL and this lives in memory
- The IOPS for the spinning disks were abysmal
Our old Riak cluster had loads of nodes, all with SSD disks, but we got excited by the idea of lots of storage with ZFS magically making it all faster. We quickly got brought back down to earth once the benchmarks started.
To get an accurate sense of performance we used the fio tool with the following settings to simulate database disk usage.
fio --randrepeat=1 --ioengine=libaio --gtod_reduce=1 --name=test \
--filename=test --bs=4k --iodepth=64 --size=4G --readwrite=randrw --rwmixread=75
On the spinning disks the maximum we ever saw in terms of IOPS were a few thousand.
read : io=3072.8MB, bw=91299KB/s, iops=22824, runt=34463msec
write: io=1023.4MB, bw=30405KB/s, iops=7601, runt=34463msec
So onto the 2nd experiment which was 5 nodes with 8 cores, 64gb ram and 4 x 800Gb SSD disks configured with hardware raid setup as a single striped disk. The performance as you would expect was a lot better but still not great.
read: io=3069.7MB, bw=127623KB/s, iops=31905, runt=24625msec
write: io=1026.1MB, bw=42704KB/s, iops=10675, runt=24625msec
Then we read that ZFS really loves to know as much about the disks as possible. So we reconfigured the raid cards to remove the disk striping and use JBOD instead. This had a sizeable improvement in terms of performance
read : io=3072.1MB, bw=469799KB/s, iops=117449 runt=6698msec
write: io=1023.4MB, bw=156403KB/s, iops=39100 runt=6698msec
Everything was now about 4 times faster just with that one simple change. So this change was definitely staying.
Then we tested the same setup with compression and a-time turned off.
read : io=3073.3MB, bw=503354KB/s, iops=125838 runt=6252msec
write: io=1022.9MB, bw=167520KB/s, iops=41879 runt=6252msec
A bit quicker but not really earth shattering so we discounted changing those settigs.
Then we turned off the ZIL just to see what affect that would have.
read : io=3068.1MB, bw=523233KB/s, iops=130808 runt=6006msec
write: io=1027.2MB, bw=175119KB/s, iops=43779 runt=6006msec
It didn’t make much of a difference so we turned it back on again.
Then we tried ashift 12 as our SSD’s are 4k disks. You lose a bit of storage space by doing this but gain some performance.
read : io=3072.4MB, bw=533512KB/s, iops=133377 runt=5897msec
write: io=1023.7MB, bw=177749KB/s, iops=44437 runt=5897msec
So for us the golden configuration was a server with 4 x 800Gb SSD’s, ZFS managing the disks directly without any hardware raid in-between, compression turned on and with ashift 12 set on the pool. With that we got approximately 133k IOPS read and 44K IOPS write.
At this stage we were pretty happy with performance so we decided to increase the node count of the cluster to 10 and start sending it production data to benchmark the writes.

On the current hardware we get by with half of the number of nodes running on the old Riak cluster while at the same time removing Redis.
Having run this now for a couple of months we are seeing a compression ratio of between 20x and 40x.
Useful Operational Metrics
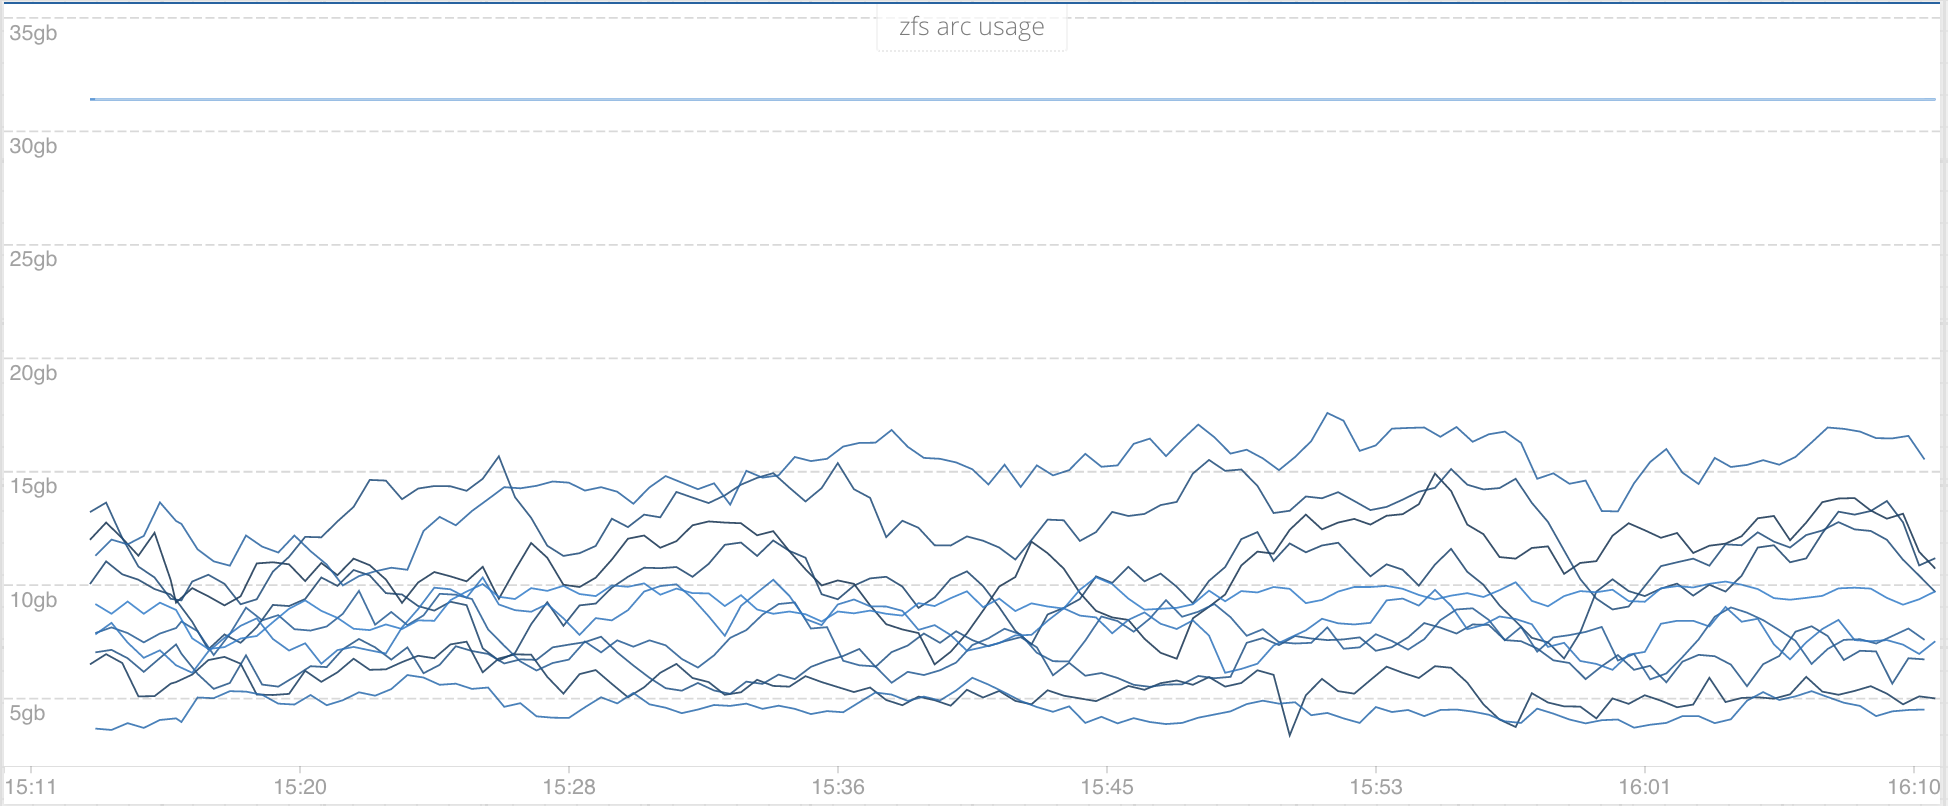
The ARC is a massive store of the most frequently accessed objects that lives in memory. You also have the L2ARC which lives on disk. We’ve switched off the L2ARC on our cluster.

We graph and alert on the size of the arc and the amount available (c and c_max). You can get those metrics by running:
cat /proc/spl/kstat/zfs/arcstats
Another useful tool for measuring performance is ‘zfs iostat’ which is like normal iostat but tells you about your pool and disk statistics.
zpool iostat -v 1
 capacity operations bandwidth
pool alloc free read write read write
---------- ----- ----- ----- ----- ----- -----
data 142G 2.71T 4.99K 0 18.8M 0
 sda4 21.4G 667G 714 0 2.49M 0
 sdb 45.2G 699G 1.23K 0 4.58M 0
 sdc 39.9G 704G 1.65K 0 6.45M 0
 sdd 35.6G 708G 1.41K 0 5.31M 0
---------- ----- ----- ----- ----- ----- -----
Another interesting metric to look at is the compression ratio. If you are running compression anyway.
zfs get compressratio
NAME PROPERTY VALUE SOURCE
data compressratio 20.34x -
data/ddb compressratio 20.39x -
data/logs compressratio 1.00x -
Then all of your usual disk space metrics that are useful regardless of ZFS.
The Future
We are still experimenting with ZFS as a few of our friends are running it in their data centres and have told a few horror stories about performance decreasing dramatically once pools fill up.
There is also a lot of fun to be had playing around with all of the other ZFS features like snapshots. We’re also formalising all of the check scripts, dashboards and alert rules up into a simple Outlyer pack for one click install.
Edit: we posted this on Reddit and got a few useful suggestions which can be found here:
https://www.reddit.com/r/sysadmin/comments/49doia/experiences_with_zfs_on_linux/