Custom Metrics from Prometheus
Prometheus is an open source pull-based monitoring tool that scrapes HTTP endpoints that expose dimensional time series data collected from hosts, services and applications.
Outlyer is able to ingest custom metrics from Prometheus endpoints and Prometheus Pushgateway by using the Prometheus integration. Follow the instructions below for a practical example.
Scrape Prometheus Endpoints with Outlyer Prometheus Integration
Suppose you have a Linux VM with the Outlyer agent running and a containerized application (Kuard) exposing its metrics in Prometheus format:
$ docker run -d --name=kuard -p 8080:8080 gcr.io/kuar-demo/kuard-amd64:1

$ curl http://localhost:8080/metrics
# HELP go_goroutines Number of goroutines that currently exist.
# TYPE go_goroutines gauge
go_goroutines 5
# HELP go_info Information about the Go environment.
# TYPE go_info gauge
go_info{version="go1.7.4"} 1
# HELP go_memstats_alloc_bytes Number of bytes allocated and still in use.
# TYPE go_memstats_alloc_bytes gauge
go_memstats_alloc_bytes 3.192064e+06
...
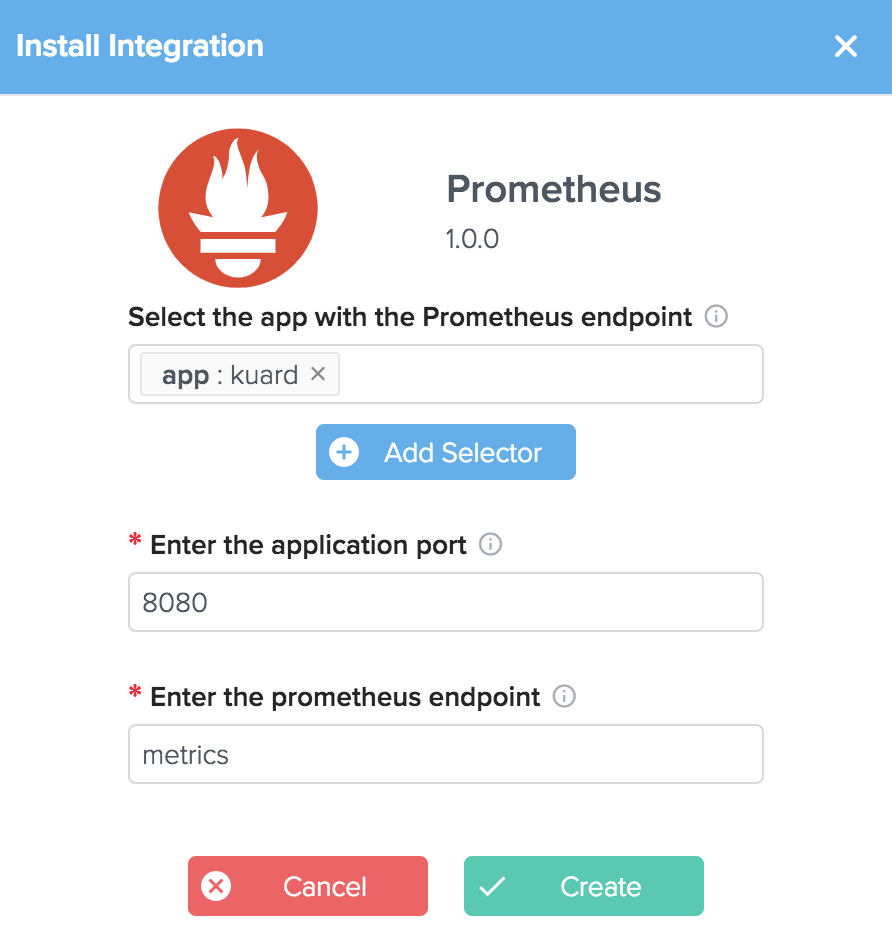
To scrape the /metrics Prometheus endpoint from the Kuard application running on port 8080, navigate to the integrations page in Outlyer and click the Install button in the right:

Enter the selector app: kuard (you could use others selectors too, like instance.hostname, container.image, etc), the Kuard port, and the Prometheus endpoint as follows and click on Create:

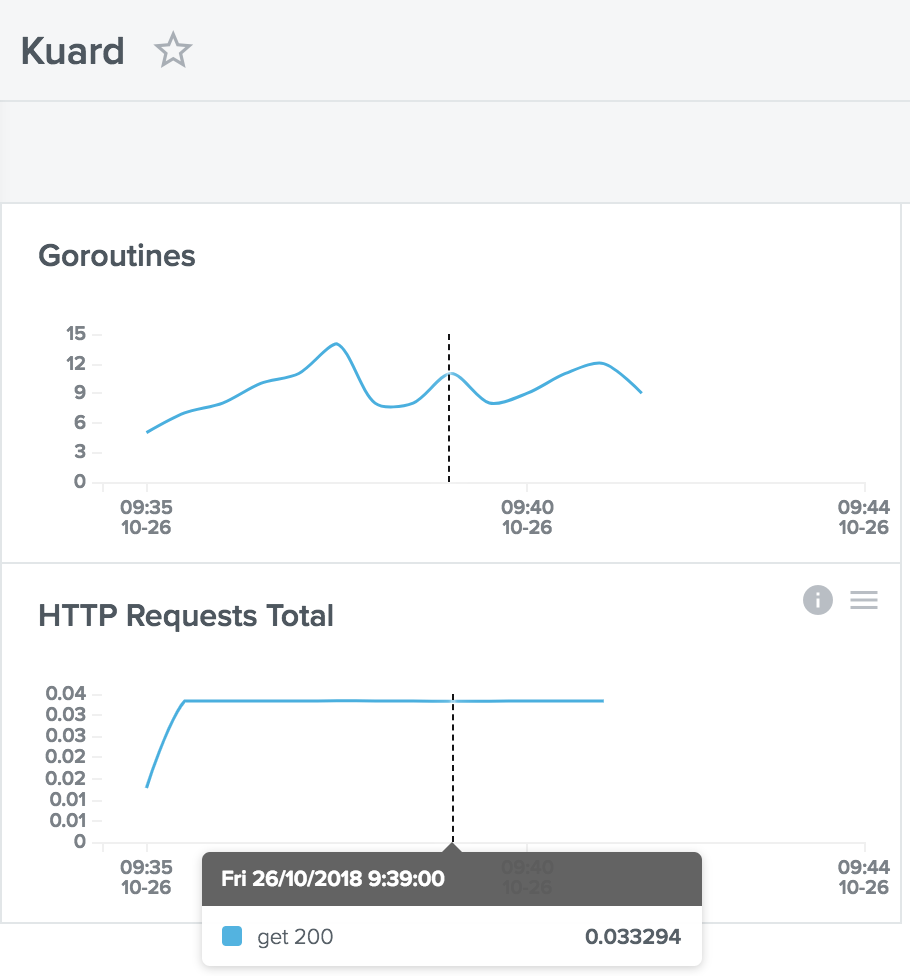
Congratulations! Now all Prometheus metrics from Kuard are available in Outlyer and you can work with them for creating dashboards, alerts, etc:

Prometheus Pushgateway
The Prometheus Pushgateway allows ephemeral and batch jobs to expose their metrics as a Prometheus endpoint. Scraping metrics from Pushgateway works exactly the same as regular Prometheus endpoints.
For example, suppose a Pushgateway instance running on a Linux VM as a Docker container and a job sending metrics to it:
$ docker run -d -p 9091:9091 prom/pushgateway

# Send metrics to Pushgateway
$ cat <<EOF | curl --data-binary @- http://localhost:9091/metrics/job/some_job/instance/some_instance
# TYPE some_metric counter
some_metric{label="val1"} 43
# TYPE another_metric gauge
# HELP another_metric Just an example.
another_metric 2398.283
EOF
The metrics sent are available at Pushgateway’s /metrics Prometheus endpoint:
$ curl http://localhost:9091/metrics
# TYPE some_metric counter
some_metric{instance="",job="some_job",label="val1"} 43
some_metric{instance="some_instance",job="some_job",label="val1"} 43
# HELP another_metric Just an example.
# TYPE another_metric gauge
another_metric{instance="",job="some_job"} 2398.283
another_metric{instance="some_instance",job="some_job"} 2398.283
Now you can simply scrape it using Outlyer Prometheus Integration.
Note that neither Outlyer nor Pushgateway will remove any metrics pushed to Pushgateway. One must remember to delete expired metrics from the Pushgateway using its API, for example:
curl -X DELETE http://localhost:9091/metrics/job/some_job/instance/some_instance