Alerts should be simple to understand and actionable when triggered. Spending lots of time fixing spammy alerts is not the most fun job in the world. Especially if you have no idea if what you are fixing is actually worth fixing.
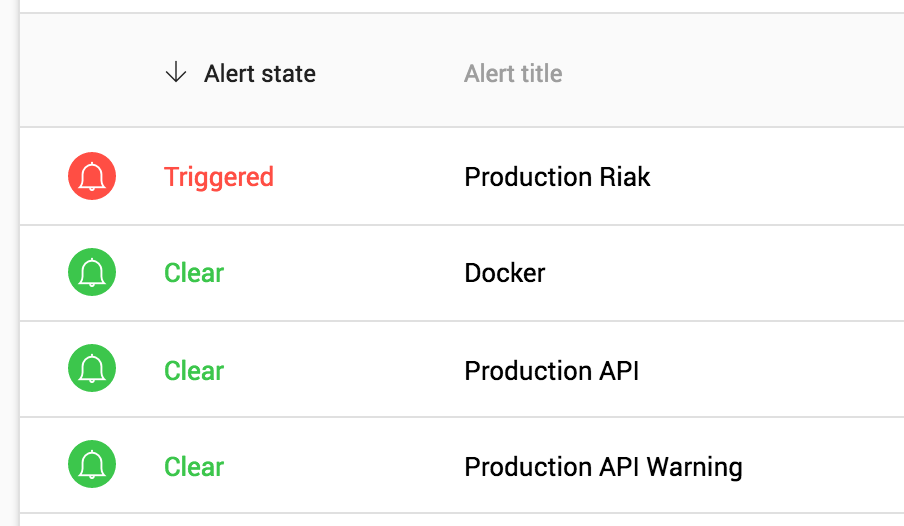
When reading a blog or watching a talk about micro services you’ll often see monitoring mentioned as one of the pain points. I would like to propose that alerting actually becomes a bit simpler to manage when you split everything out into services.
Organisation structures take many shapes. The most common we tend to see is an ‘operations as a service’ team sitting alongside development teams who have an embedded mix of skills.
SRE’s (site reliability engineers) focus on the infrastructure and standardised methods of deploying, monitoring and securing everything. They create tooling and automation to devolve a lot of the tasks via api’s and portals into the other service oriented teams. Mostly so these other teams can work standalone without getting held up waiting for things and so they can take full end-to-end responsibility for running the service.
If you see your organisation moving in this direction then you’ll probably want to start thinking about devolving down the responsibility of setting up monitoring to each team. This is where I think things become a lot simpler from an alerting perspective.
Each team usually has a strong direction in terms of objectives. This focus makes setting up critical alerts on the business problems much easier. For example if you’re running the payments service it’s pretty obvious that there should be some monitoring around transactions per second and error rates. In the old world where operations would guess at these things, or spend a lot of time sourcing this information, this is now setup by those with the service specific knowledge.
We’ve spent quite a lot of time making it really easy for anyone in a team to setup custom monitoring for their service. A lot of those features also make it an absolute breeze to troubleshoot an alert. You just click the failing plugin, select the server it was broken on and hit run. You can even fix it up in place, test it, save it and it deploys. Which means even if your alerts are a bit trigger happy to start with anyone can rapidly troubleshoot and fix them.
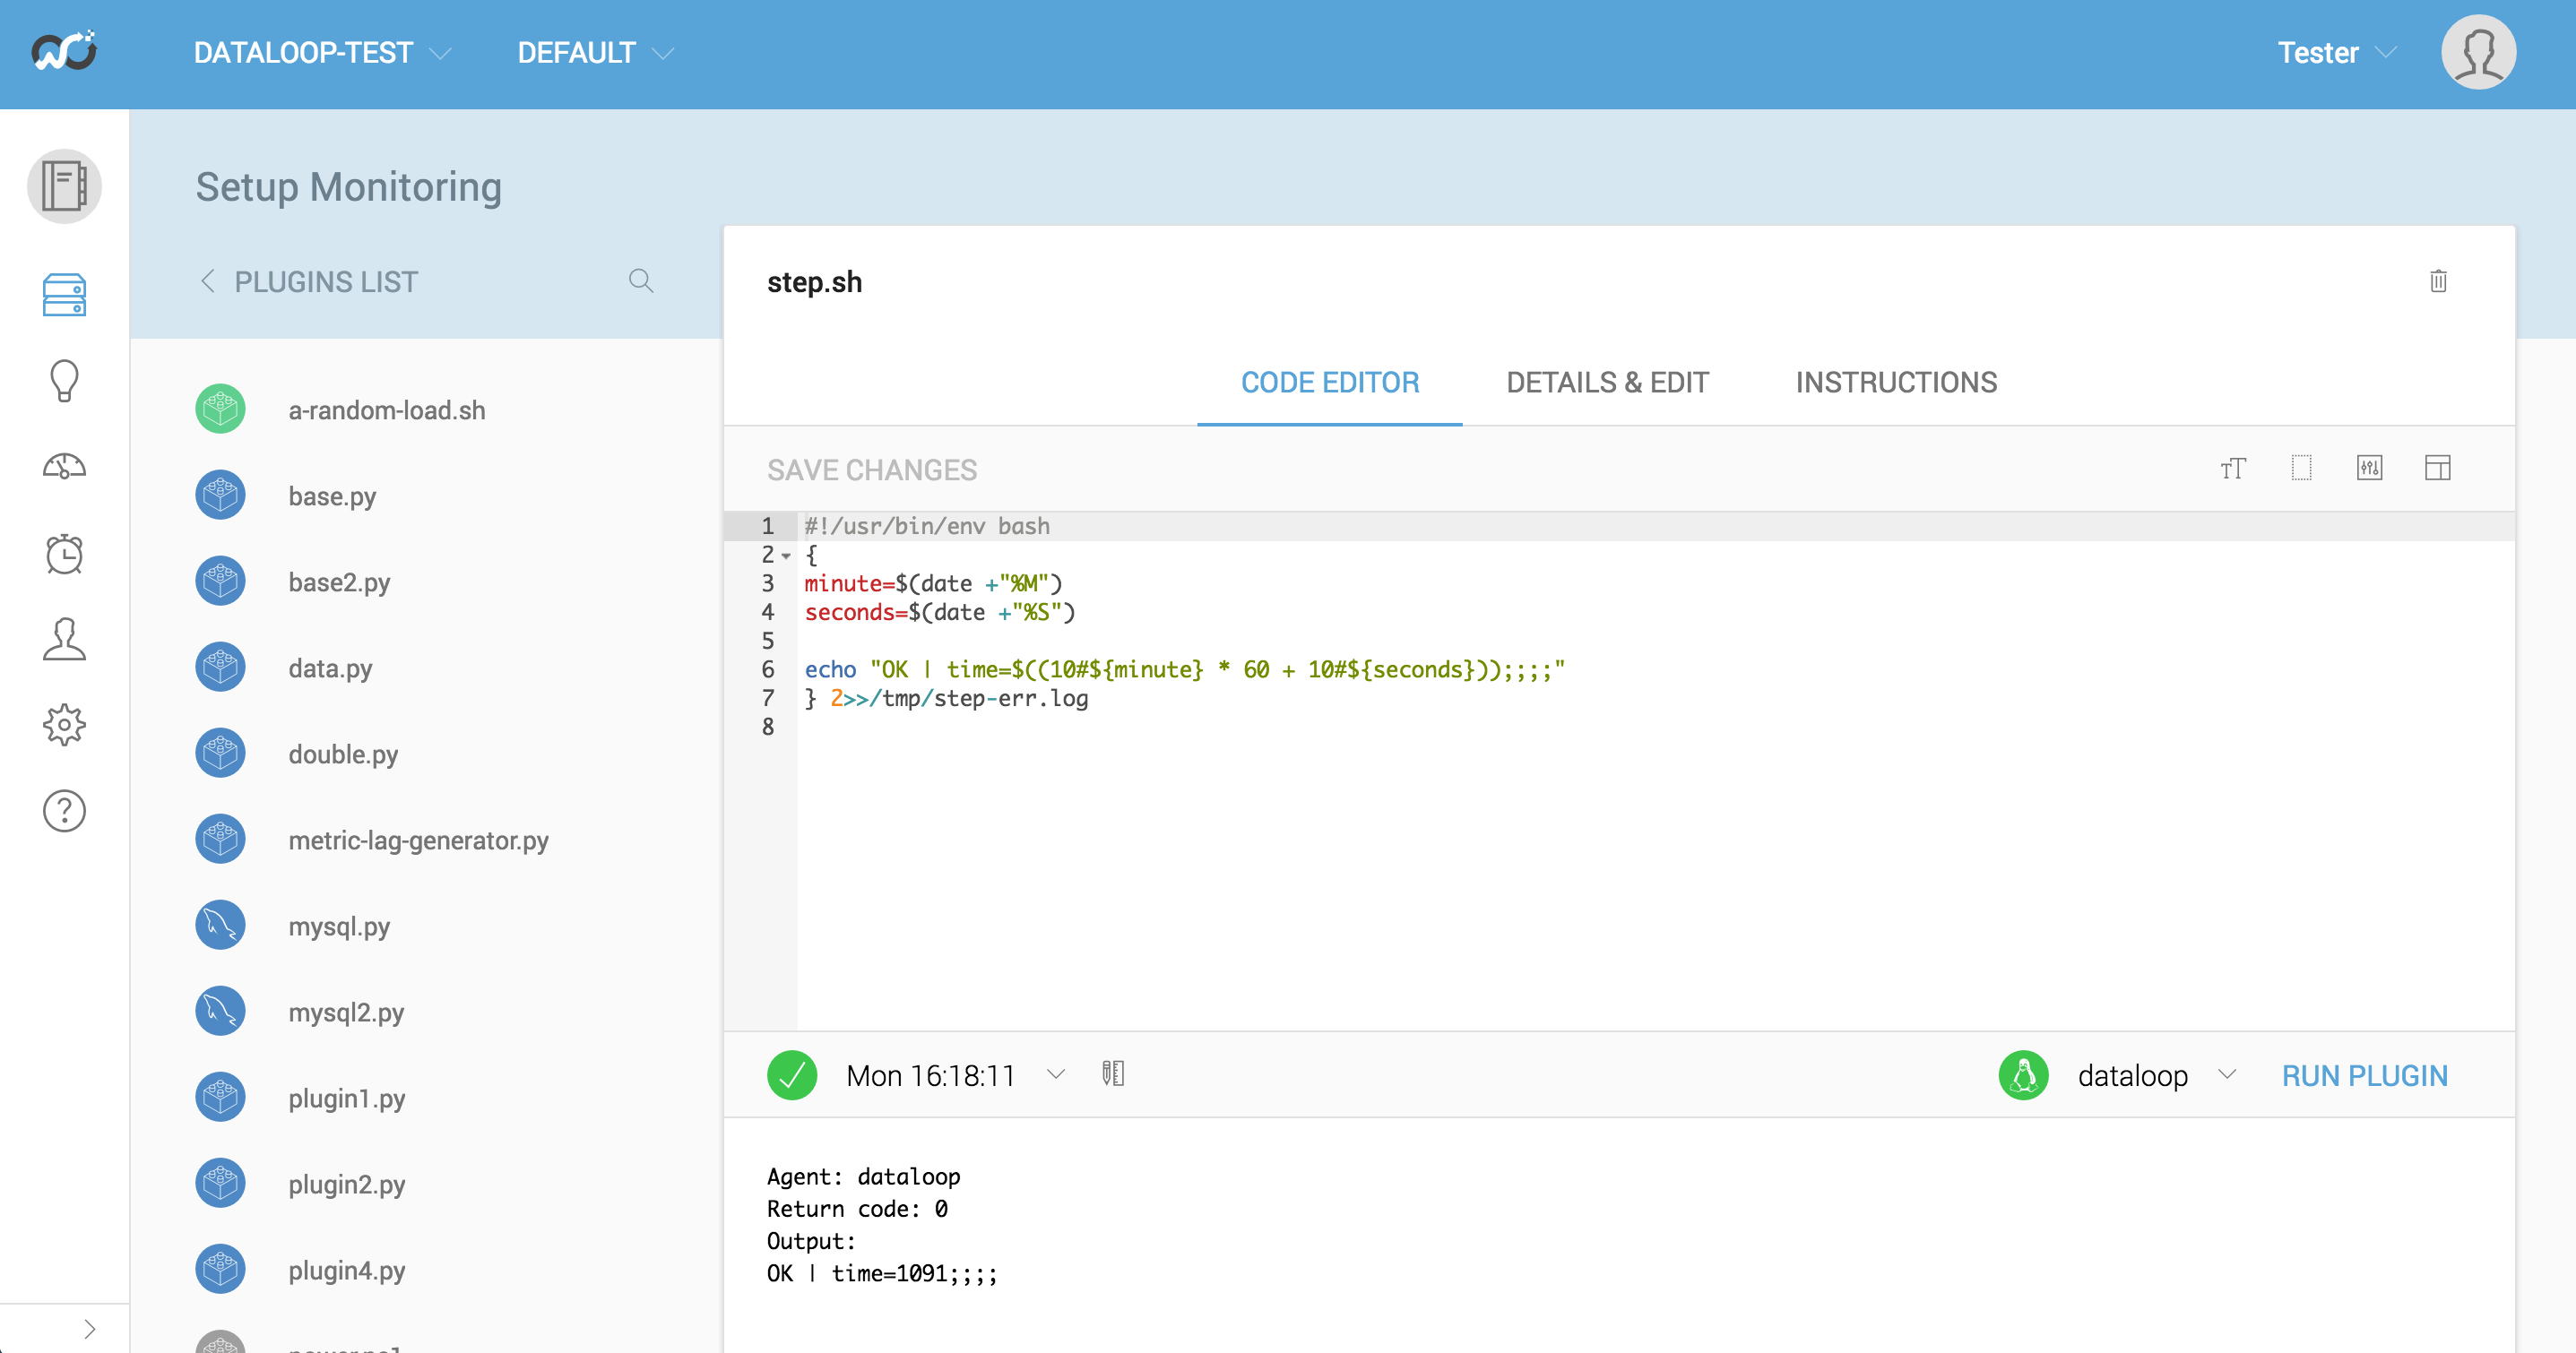
When you put teams on the hook for the whole service they generally get quite interested in monitoring. The pain of not knowing becomes greater than the pain of implementing good quality metric collection, visualisation and alerting.
Another area where things have got simpler is dependency mappings. Micro services architectures encourage isolation. Cascading failure is the enemy of large complex distributed systems so most teams put work into protecting against that. You should be able to monitor each service independently without setting up complex spider diagrams of interconnected things that may fail.
This means you can have your SRE team focus on monitoring the infrastructure and set some clear alert rules and actions related to the services they provide. Then each of the other teams can setup some fine grained alerting for things that matter to them.
What does all of this look like in practice? For the teams themselves it comes back to just worrying about the basics of alerting. Except, now they can worry about their own piece of the puzzle rather than trying to architect a grand strategy across the board.
The way we typically set things up is that alerts contain multiple criteria and multiple actions. You can think of it in terms of ‘if this then that’. If this thing breaks then tell that group of people.
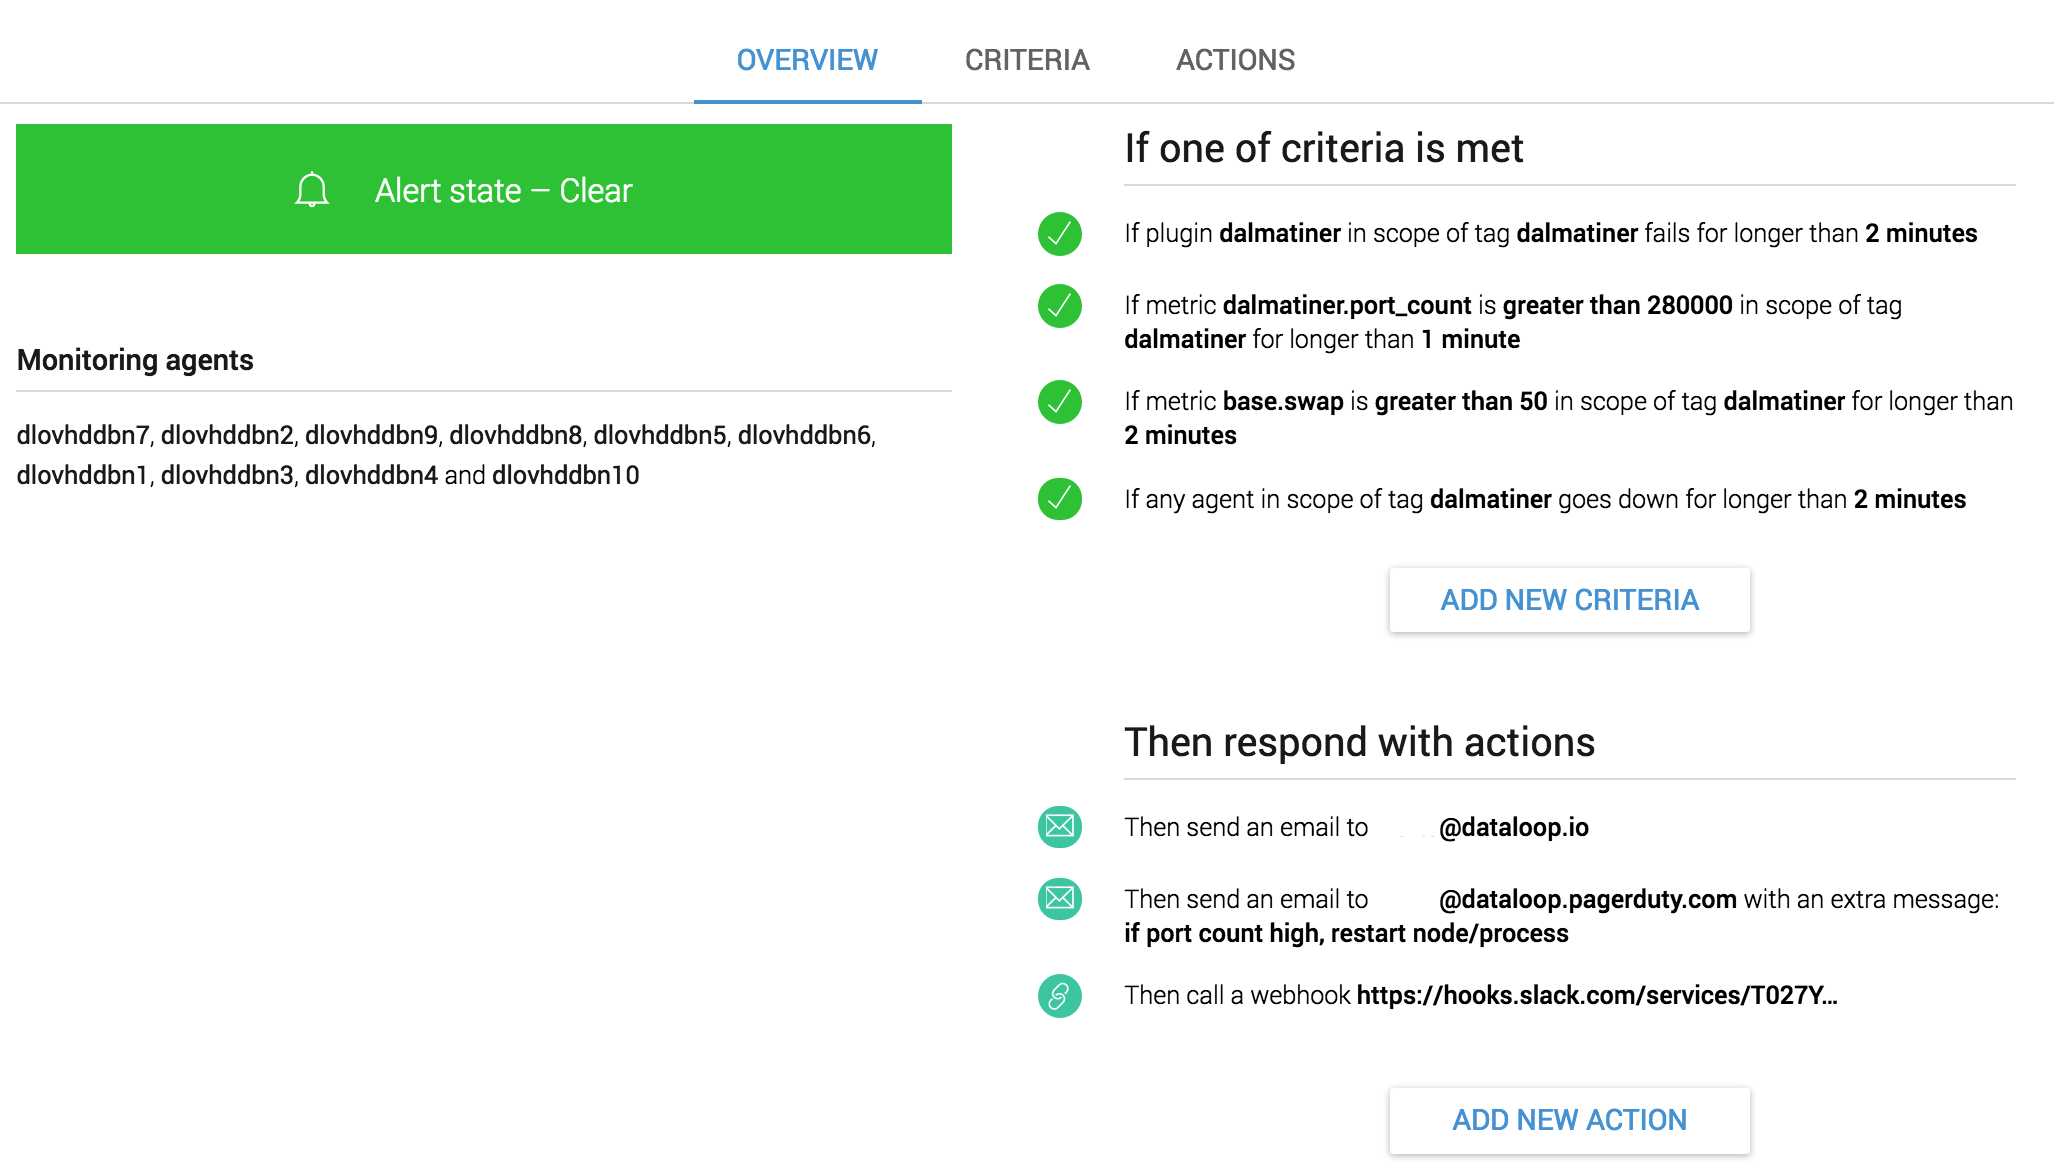
As you can see from the picture above the database team has started to add checks around critical failure conditions and gets woken up when they trigger. High memory usage, open port counts, service checks or even servers going down have all in the past caused major problems so they get added to the wake up list.
We tend to group highly critical checks together for a service and set the actions on those to notify whoever is on call. Most monitoring systems, ours included, have integrations into Pagerduty and VictorOps for handling the on call rota and sending of the SMS and phone calls. As well as escalations and other fancy things.
Another alert grouping can be created for warnings. In this bucket you might start to add checks for things that shouldn’t necessarily wake people up, but should definitely inform and result in some investigation. API response times fit nicely into this category. The actions on this group might be to only send a message into a chat room.
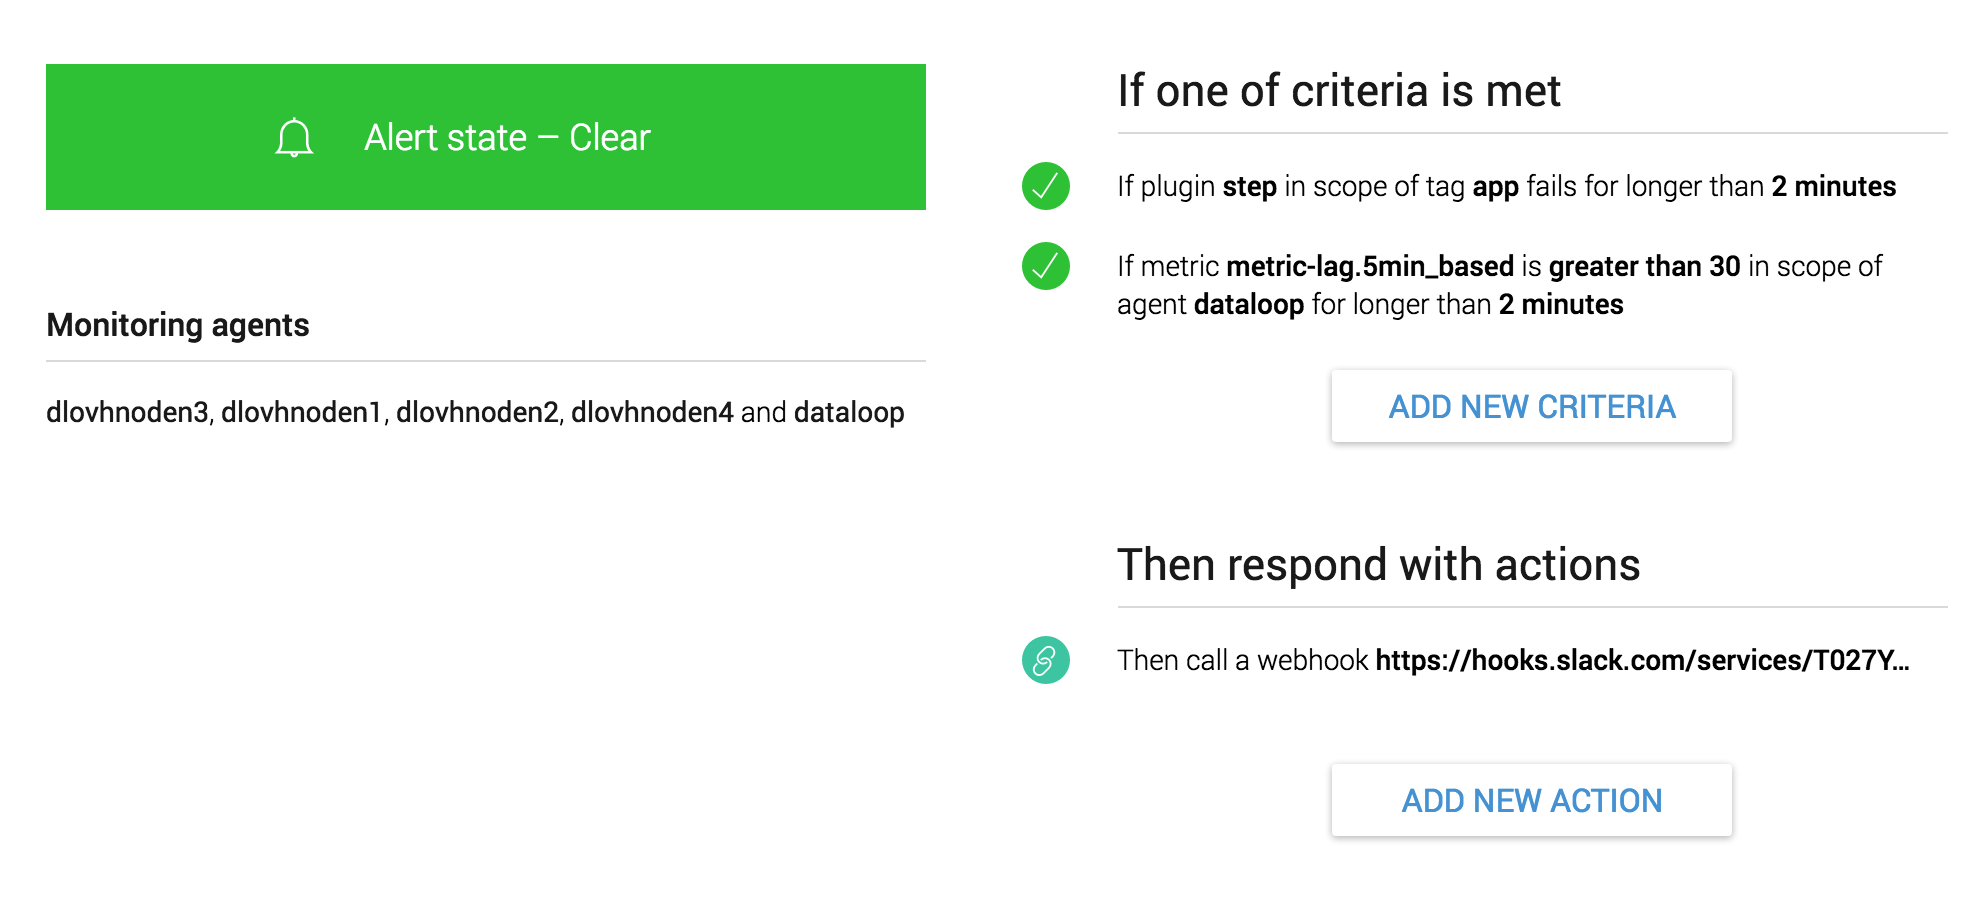
In the above picture the team has created a couple of check scripts to measure data accuracy of the database. We have a check script called Step.py that simply measures data incrementing over time and lag measures any deviation in time from accepting the metric to us being able to display it.
The team generates some data with simple bash and python scripts and we pull the data out every 30 seconds and check it. Generating the sine waves was quite a cool idea that I’m sure only the team building the service would have thought up.
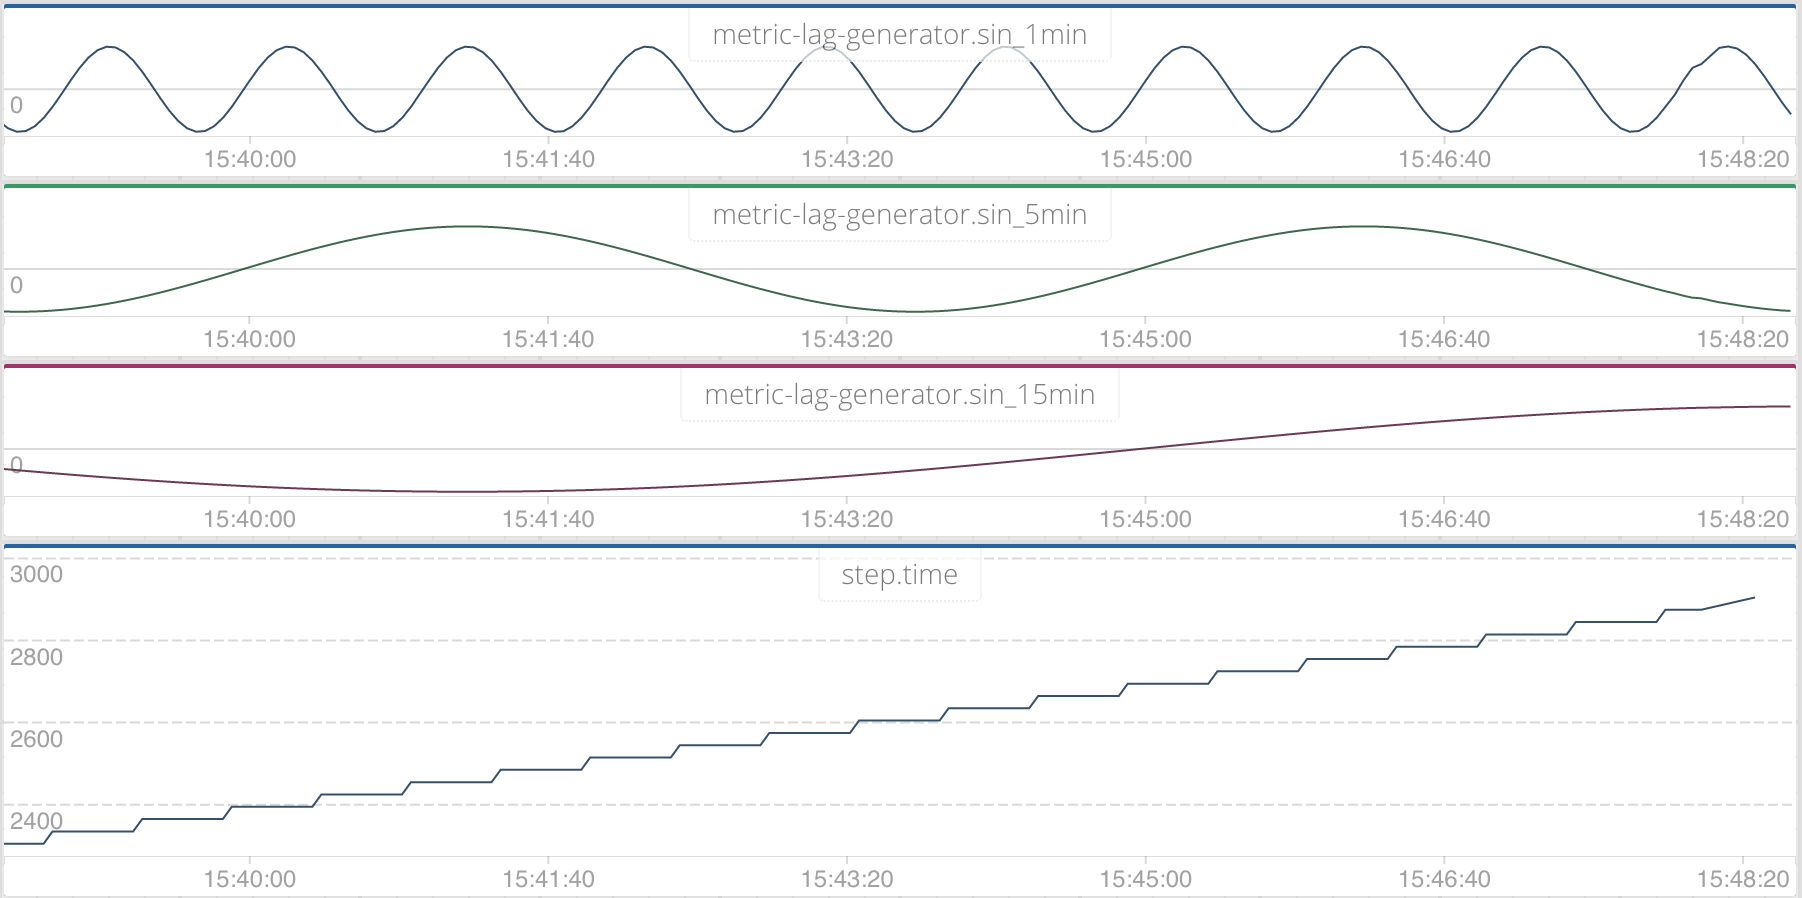
Sometimes the simplest checks are the most useful.
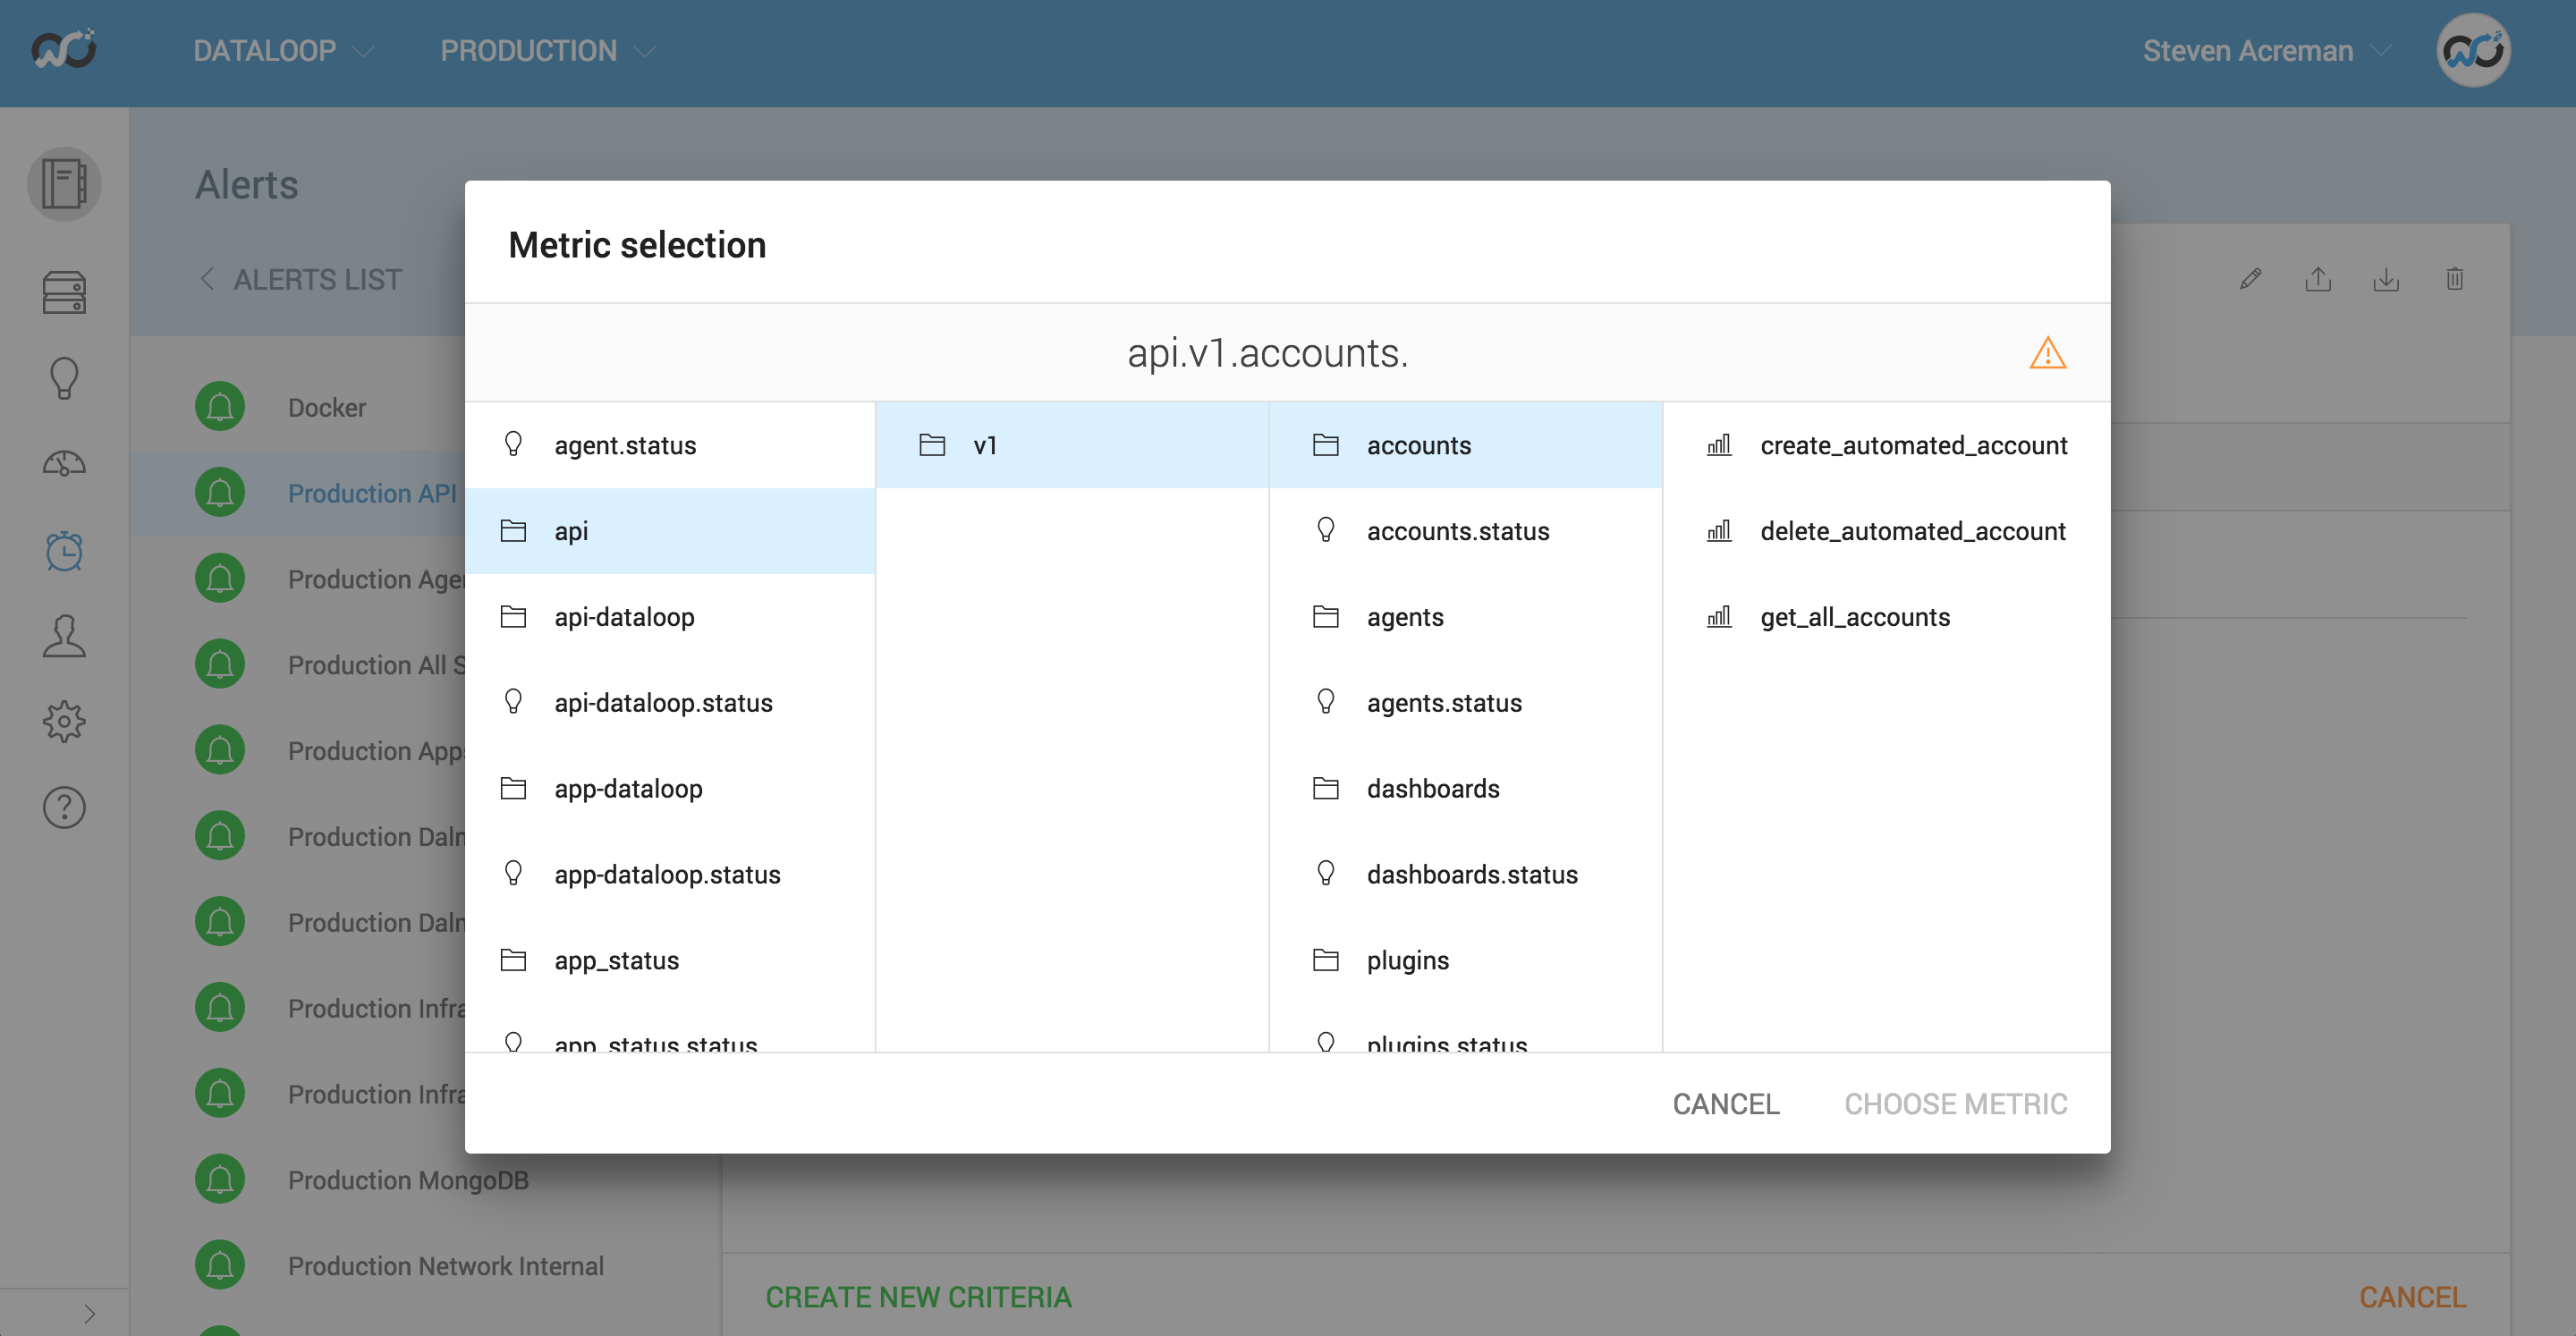
We collect thousands of metrics across our service and we use them mostly to explore what’s going on in our dashboards. We’re extremely selective about what we alert on though and generally only add metrics into alert groups once we know they are important and how to act to address them if they trigger.
At Outlyer we’re still quite a small company of less than 10 people (almost entirely developers). Our systems are all split out into independently scalable services and we don’t have an exact mapping of people to services. Although we do have the notion of people who are better at front end, backend and operational stuff. Our alerting evolves over time by the people who are best in their particular areas.
The core of our service is our time series database and the stream processing. That’s mostly built in Erlang and it makes no sense for anyone but the Erlang developers to get woken up when that goes wrong. So those guys have their own alert groups for each of the services split up into critical checks that wake them and warnings that notify them of something starting to go wrong in Slack.
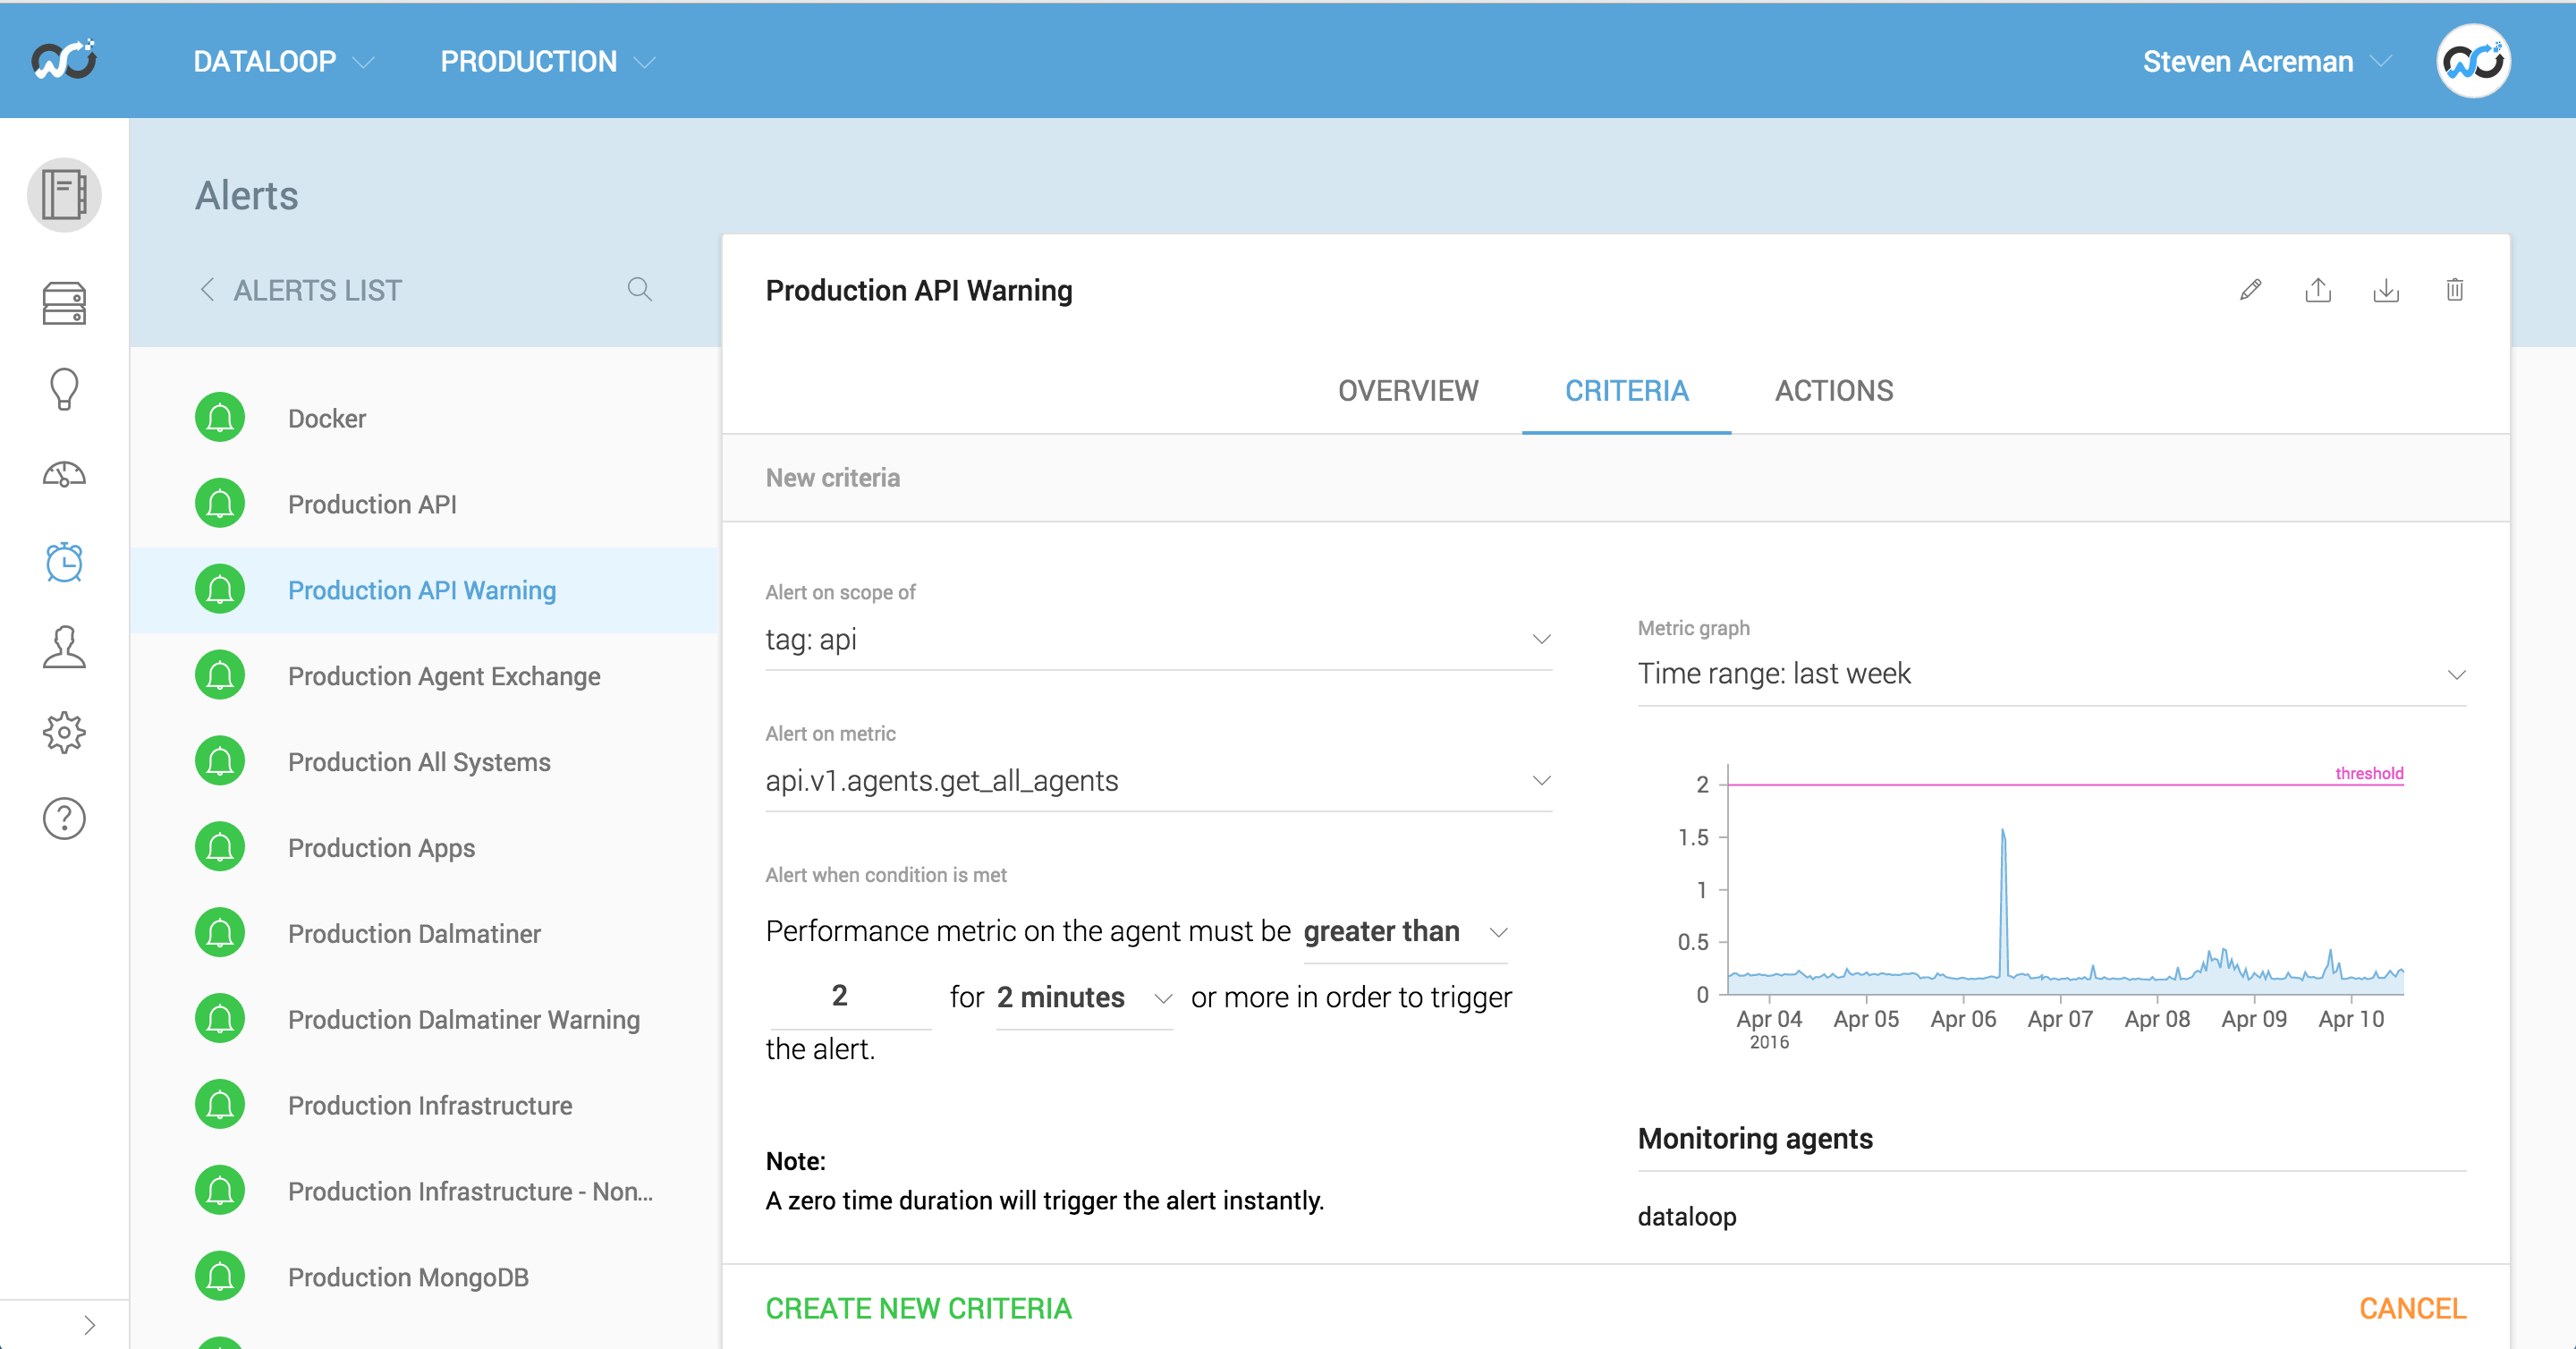
As you can see it’s pretty easy for anyone to setup an alert and choose a sensible threshold for it.
The same is true with the services written in NodeJS and the front end, as well as the underpinning 3rd party open source stuff we use without modifying like RabbitMQ and Redis etc. The guys who wrote the node stuff make rules groups for themselves. The more Ops focussed people (which is really just me and Tom) only manage a few rules related to shared off the shelf stuff.
This all fits in closely with the philosophy of ‘you build it and you run it’ which makes a massive difference to the quality of service provided to customers. Waking people up to log tickets (that then get ignored) before rebooting is a very out dated way of working which has a noticeable affect on both the culture of an organisation and what customers experience.
Hopefully you’ll give Outlyer a try and provide some feedback around our alerting. We think we’ve made monitoring and alerting a lot easier for companies running micro services. Even if you use another monitoring product hopefully some of these ideas will be useful.