The alerting system in Outlyer has undergone a complete overhaul over the past couple of months. Today we’ve released our Alerts V2.
The old alerting was based on processing streams of time series data directly from the queues by our workers. This isn’t too hard when everything resides on a single server but as soon as you want to distribute processing over multiple servers without any single points of failure the state needs to live somewhere. We stored this state in Riak which worked reasonably well. However, processing streams of data and modifying state in real time resulted in a few edge cases where state would mutate incorrectly.
Since alerting is a key piece of functionality in Outlyer that needs to be 100% reliable we looked at the architecture and decided to do things differently. Instead of processing the data in-flight off the queue we would instead simply query our time series database. We’re using DalmatinerDB which can easily handle millions of requests per second, and alerting from the same data displayed in dashboards seemed like a sensible idea.
We also took the opportunity to redo the criteria and rules state machine to account for no-data alerting. The other advantage is that in future releases we’ll allow alerting using SQL style database queries.
A Quick Demo
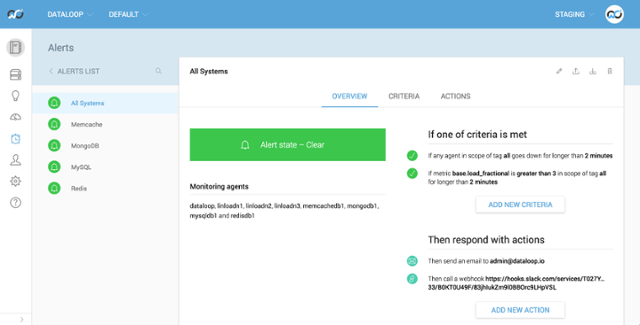
I have a few alert rules setup for various things. There’s the usual All Systems rule setup to alert me if any servers go down via email and Slack message. As well as to alert me if any of my servers have high load.

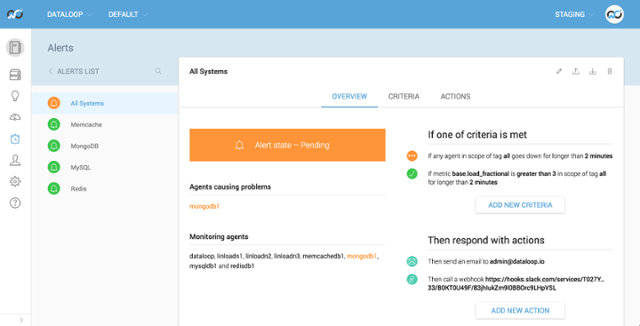
In this example I’m going to kill the agent process ungracefully on the mongodb1 server. This is running MongoDB and there’s another rule setup to monitor that service too. After 30 seconds or so it’s going to enter a pending state because it has detected the agent has disappeared but it’s going to wait for the duration set in case it’s a blip. It will also gather up and summarise all of the problems within the alert rule into a single alert notification so you don’t get spammed.

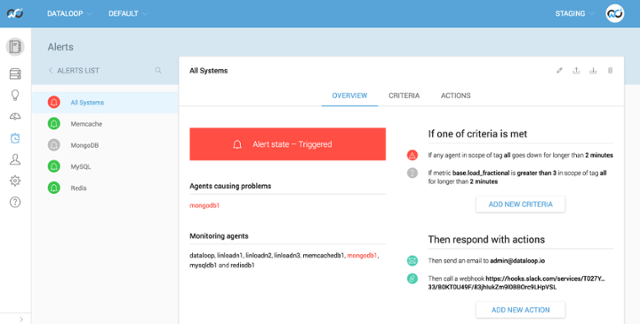
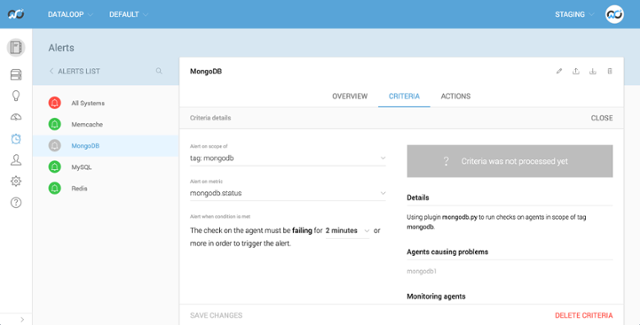
Once the duration (in this case 2 minutes) is over the alert will turn red. What’s also important to notice is that some of your other rules will turn grey because no data is being returned within the criteria. In this case the MongoDB rule turns grey because the plugin is no longer running (we killed the agent it was running on). This doesn’t mean you’ll no longer get alerted for other boxes within that rule, it’s merely a visual indication that something isn’t sending back data and you probably want to have a look at which criteria and agent it is.

So now we can see that the All Systems rule is red and will have sent us some notifications. Also that the base.load_fractional criteria is grey because mongodb1 is no longer sending back any base metrics. As well as the MongoDB rule being grey because the mongodb.py is no longer running. If you click into the criteria it will tell you which agent is causing the problems, which is useful when you have an alert setup on a tag with many agents inside.

In the next few days we’ll be releasing a few more features. We’ll be adding a tickbox on the criteria page to alert on no-data. Which if we had ticked on this mongodb.status rule would have turned the rule red instead of grey. This means if you want to get alerted if a plugin fails OR if the plugin isnt running you no longer need to create a second agent.status rule which was necessary in the past.
We’re also going to add ‘alert on worse’ which means that alert rules will send additional notifications when things get worse within a rule. For example if you have 15 MySQL servers being monitored by a rule and you lose 3 of them initially and get an email or Slack message to say they are down. Then a little while later you lose an additional 2 servers. We’ll send another alert for the same rule with what else has broken, as well as individual recovery emails.
Beyond that, as mentioned above, we will be adding an advanced tab to allow complex rule creation with SQL style queries directly against the database. This means you’ll be able to use a lot of cool maths and functions which will very very useful for container monitoring. We’re also planning on implementing a pause button globally and on each rule group which can be used for scheduled downtime (both in the UI and via the API and command line utility).