We started Outlyer in 2013 with a bold vision, to be the world’s first self-service monitoring platform with the goal of helping teams build better software for their users at a faster pace.
With the increased migration to DevOps, the cloud and microservices, our vision of self-service monitoring proved valid, and we quickly grew. However, the execution provided many challenges, and we’ve learned some valuable lessons over the past 5 years. Specifically, we were late to the party with Docker support, and unforeseen usage patterns hampered our scaling as we added more customers, which left parts our solution lacking.
By April 2017, it became clear that we had to fundamentally change the way we designed and built our service if we wanted to continue to fulfill our vision. What started as a redesign turned into a complete overhaul of our product. Now a little over 14 months after we committed the first line of code, we are proud to announce that we are releasing Outlyer V2 to the public.
Starting today anyone can sign up and try it for themselves.
As they say, what doesn’t kill you only makes you stronger, and the lessons learned the past 18 months have been hard but pushed us to build a better product, which we believe is best of class in our category.
Infrastructure monitoring is hard, especially if you want to make it simple and self-service. Scaling it as the volume of metrics increases exponentially makes it even harder. I’m incredibly proud of what the team have achieved, and its reflected in the feedback from new customers and existing ones that have been using it since January with great results.
Those early users have really helped us hone in on our strengths, and we are launching a better product because of it. Thank you to all of our customers that worked with us as we took on this challenging journey to relaunch our product, we are extremely grateful for your support.
Our Self-Service Vision - The Thing That Makes Us Different
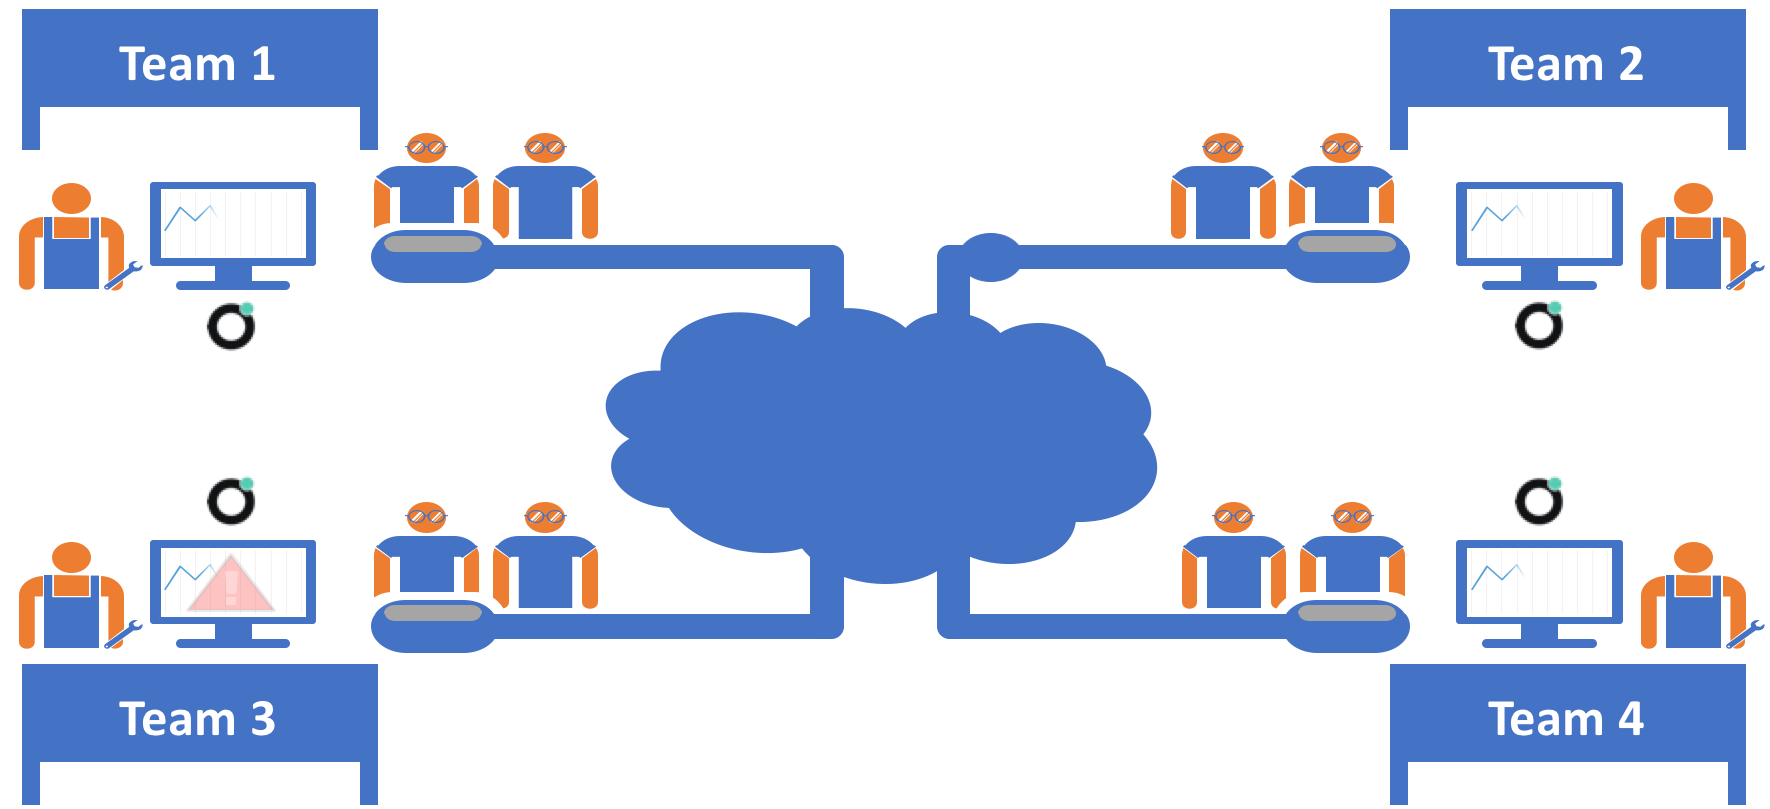
We believe that monitoring should be self-service at every stage from collection to consumption of the data. Nearly every monitoring tool out there that claims “self-service” really is only about consumption, building dashboards and alerts. However collection is still an operations task, or requires operations/DevOps teams to build a lot of tooling around the solution to empower their developers and other users to setup monitoring by themselves.
Outlyer, out of the box, provides a simple and scalable platform that you can give to your teams, and with our delegated remote configuration technology, allows any user you delegate permissions to, the ability to setup their own monitoring in a few clicks, or a few commands with our CLI tool.
A team wants to monitor MySQL? No problem, they can do it themselves in a couple of clicks and start seeing metrics in seconds! They need a custom check to make sure the backup service their service relies on is working properly? No problem, they can write and deploy it themselves in minutes. Operations and DevOps teams become consultants to their teams helping them get better monitoring, instead of being buried in busy work setting it up for them all the time as their requirements change.
We believe this is the right model for where the world is heading with DevOps and Microservices, and because monitoring is a journey, not a destination, we’ve made it as low friction as possible to ensure adoption as your services evolve.
Outlyer customers don’t setup monitoring, they provide it to their teams. Outlyer users write hundreds of custom checks, because it’s so easy, and don’t get stuck with what’s provided out of the box like on other solutions.
Outlyer customers scale up and stay agile as their service grows, with every team having the visibility they need to build and manage their services in production. Outlyer users collaborate around data in real time to ultimately deliver better, faster and highly available software to their end users.
What’s New
Outlyer V2 is a complete redesign from the ground up. Literally everything has been touched in this release so it’s impossible to cover everything we’ve been working on the past 18 months, so here are the highlights:
New Architecture Built for Scale & Performance
Our previous release used an Erlang time-series database (TSDB) based on Riak called Dalmatiner. While it sounded great in principle, we were the only major user of the TSDB, which meant we ended up pushing it past its original limits and had to dedicate significant resources to building and scaling something that had never run at our intended scale before. As a TSDB is critical to a monitoring platform’s ability to scale and maintain performance and reliability, we decided we had to take a new approach and use something that had already been proven to run at our desired scale. We decided to replace our previous TSDB with Altas from Netflix. Additionally, we added a completely new multi-tier sharded architecture that enables us to scale larger customers individually with their own data retention rules.
This area warrants an entire blog on its own, but suffice to say, we have a completely new TSDB engine that can now scale to billions of metrics per day, while delivering broad analytics queries in sub-second response times.
We also decided that if we were going to be the best self-service monitoring tool then we also had to build our service using the same technology our customers were using. This led us to build an entirely new platform on Kubernetes and AWS, which significantly improved our performance and reliability compared to our previous hosting provider.
Powerful Analytics
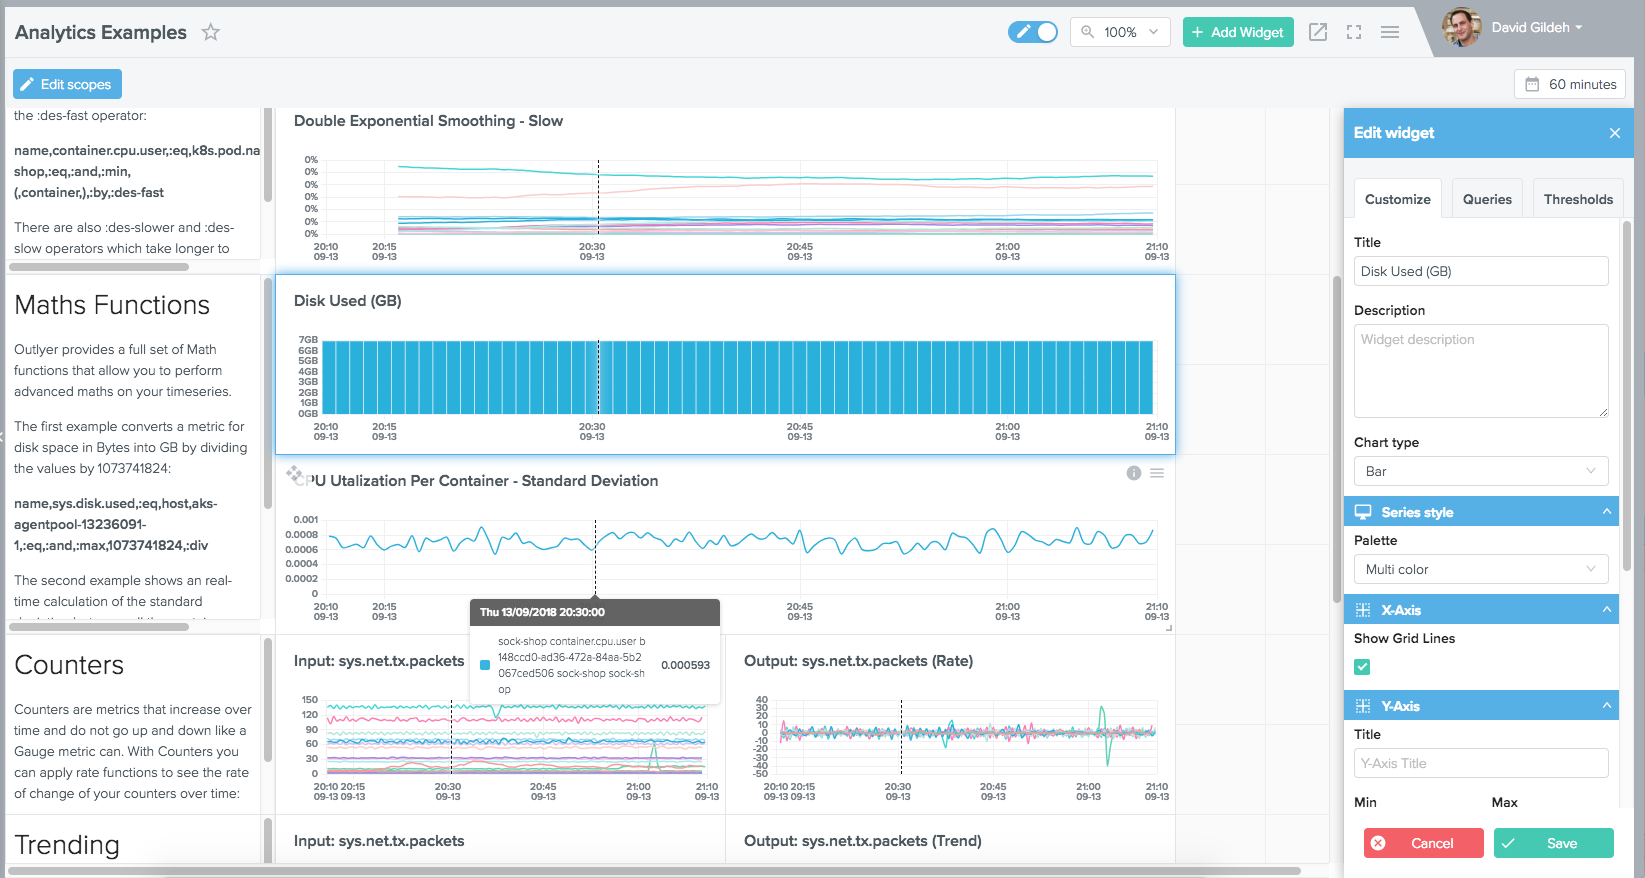
With a solid TSDB platform to build on, we completely redesigned our dashboards and alerts to take advantage of our new capabilities. Instead of the old tree based graphite metric approach used in V1, V2 uses dimensional metrics (labelled metrics) all the way from our agent to the UI. Using our query builder and new query language, we can now run powerful ad-hoc queries across all metrics at scale in real-time.
Our new dashboards UI supports dropdown scopes, 7 different charting options, correlated pointer lines so you can correlate between charts on the same dashboard, the ability to zoom into a time period using drag select, and also allows you to overlay multiple queries on the same chart, so you can compare metrics week-over-week.
Additionally, you can use an array of functions to transform your metrics in real-time.
Status Views
Our new agent automatically discovers metadata from your Cloud provider, or Kubernetes cluster, without any additional configuration, allowing you to quickly see what’s in your environment as soon as you deploy the agent, and start pushing checks to them to monitor your services. The labels also allow you to filter and group your instances into specific views, which you can save and share with your team.
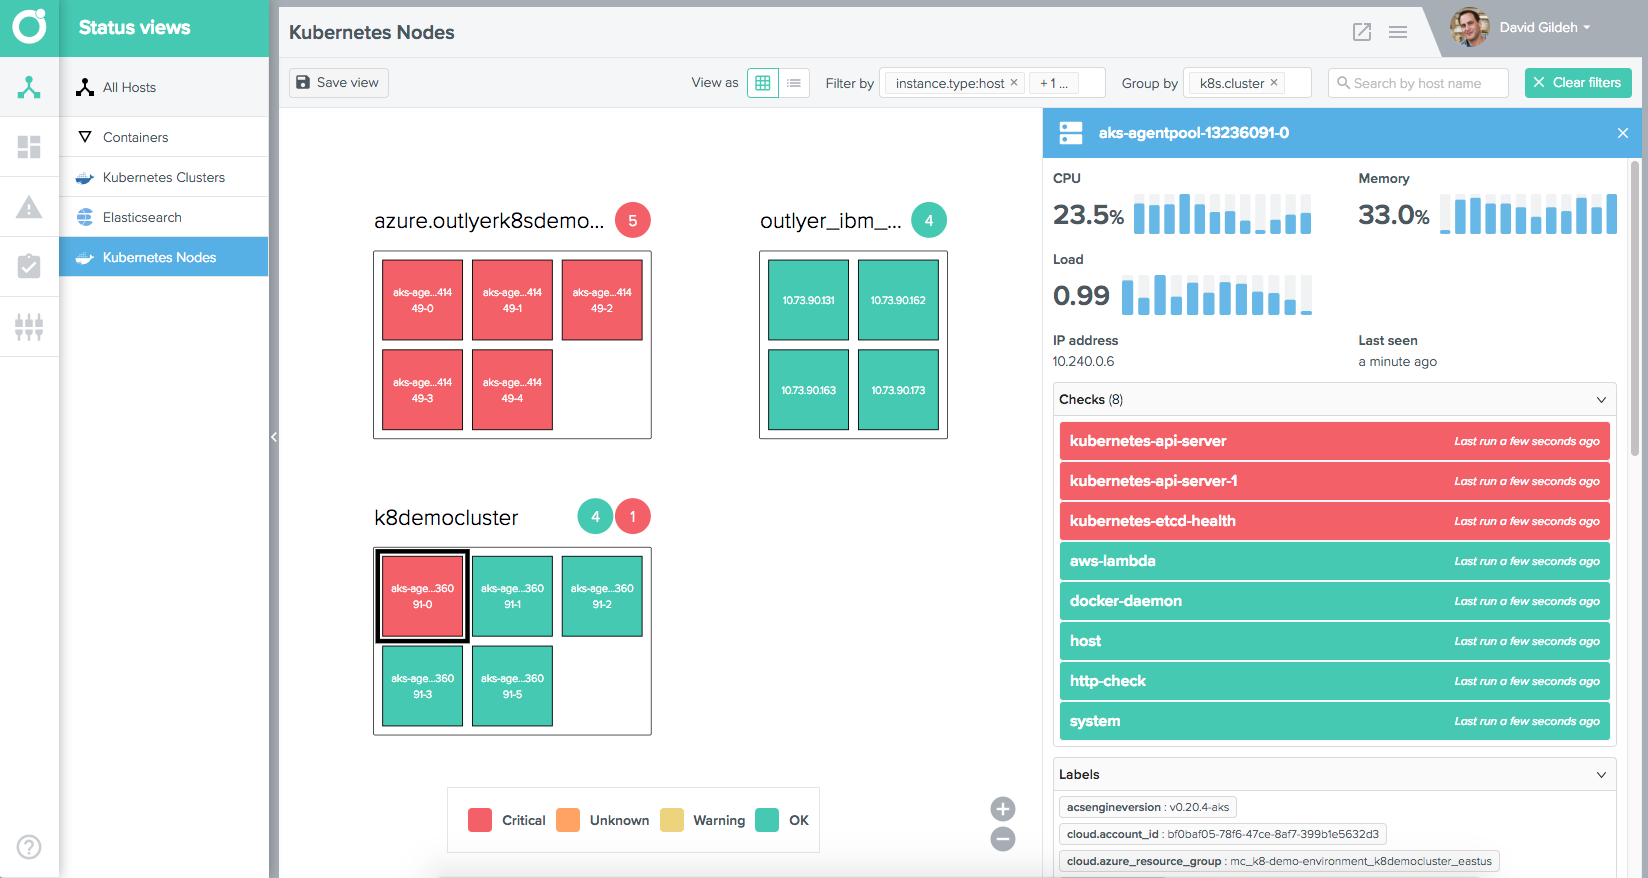
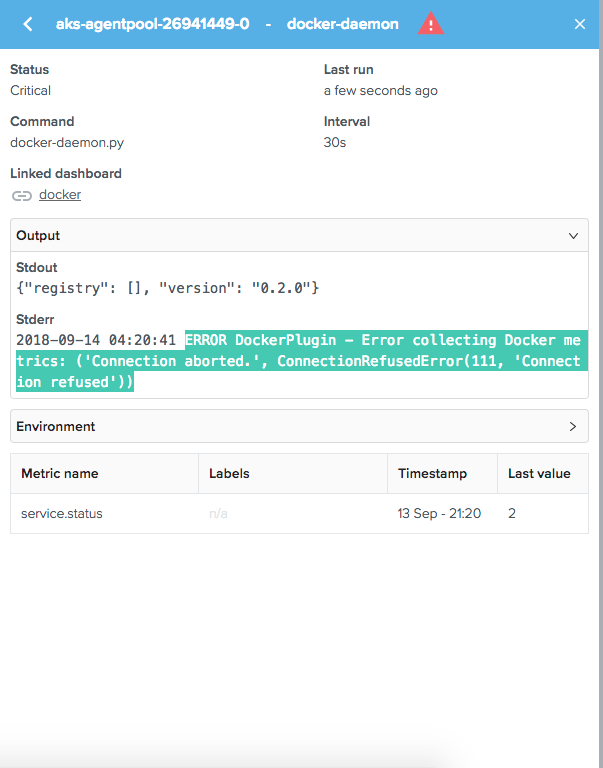
By clicking on an instance, whether its a host, container of Kubernetes pod, you can immediately see its current status, what checks are running against it and even open the check to see the last results and why its failing in the same view. From the check you can also jump to linked dashboards which allow you to see historic metrics for that instance and troubleshoot.
Frictionless Setup
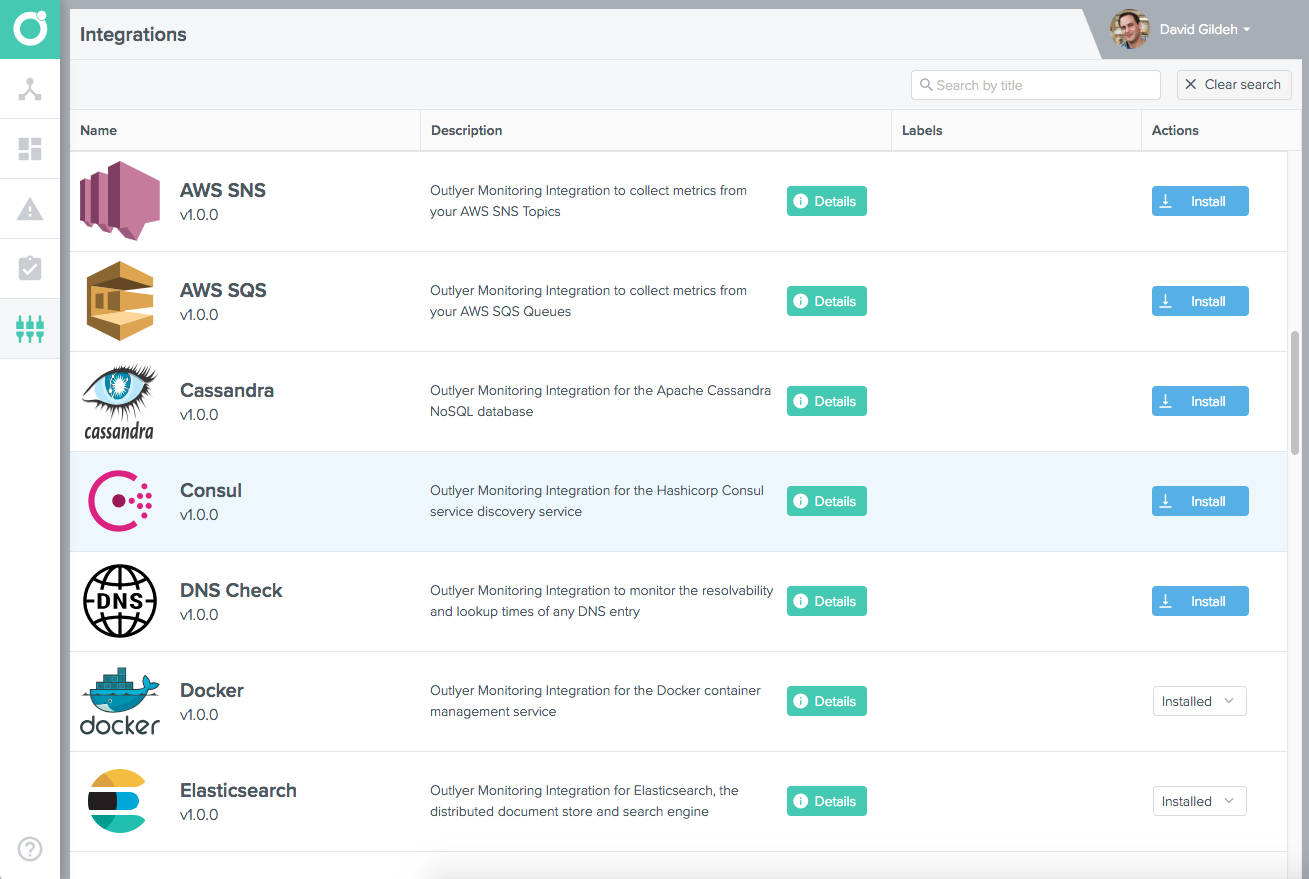
We’ve completely redesigned our Integrations, with over 40 of the most common integrations out of the box available today, and loads more coming soon. In one click you can install everything you need to monitor services in your environments and deploy them in seconds across all your connected agents. You can view all our out of the box integrations on our Integrations Page.
The V2 release enables this by building on the unique remote deployment technology we developed in V1. This allows you to push out new checks and plugins to monitor your services in real time as you make changes in our UI, REST API or Command-Line Interface (CLI). However like everything else in V2, its been completely redesigned from the ground up with a new checks model that allows you to configure plugin checks with different configuration settings that automatically run whenever a host or container appear matching the label selectors defined in the check. Your checks work exaclty the same regardless of whether your service is running on a host, inside a container or Kubernetes Pod, or even on remote devices. This makes the learning curve to get started really easy.
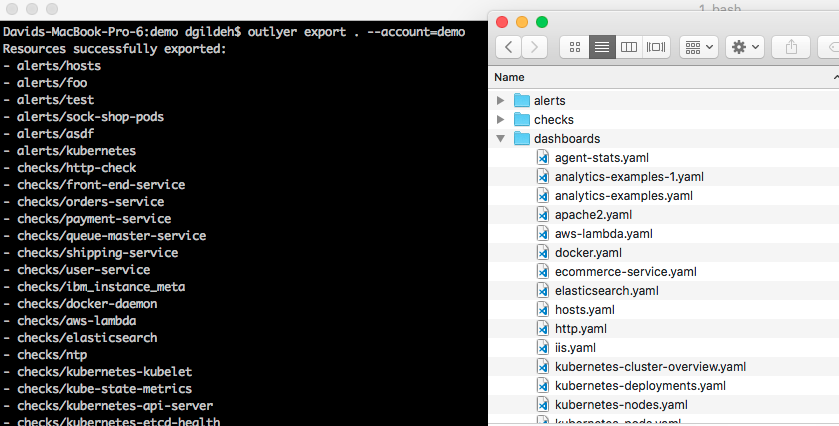
Our new CLI allows you to import and export your entire account configuration to local disk, where it can be version controlled in git, in two simple commands. Everything from plugins, checks, dashboards, status views, and alerts, can now be managed by the CLI on your local desktop, and stored in your preferred source control repository, out of the box.
What’s Next?
As with any large software release we had to make some trade-offs to hit our GA milestone. The new release has been designed in a way that makes it easy for us to quickly innovate and add new features going forwards using microservices. All of our ideas come back to the same simple principle - to make monitoring self-service and empower teams to collaborate and build better software for their users.
Most of the work we plan to do in the short term is to improve what’s there already: better dashboards, better alerts, better status views; essentially add in all the little things that fell out while we pushed towards GA to make even better.
However longer term, we want to focus on adding context to your monitoring and help your teams really understand what’s going on no matter how complex their environment. This will involve new agent capabilities, new types of status views, and ultimately more integrations to our fast growing list so users can pull in data from almost anywhere out of the box!
Try Outlyer Monitoring For Free Now!
With this new release we have also revamped our pricing plans and it is our goal to make it as easy as possible for new users to access.
To that end, we are releasing a new Free tier with competitive upgrade options available for users that need more data retention, agents, support and analytics capabilities.
From signup to setup only takes a few minutes and with our unique remote deployment technology, so you will be able to get full visibility across your environment with just a few clicks of the mouse.