Recently I’ve been documenting our API’s using Slate which is a static site generator. It turns markdown text into pretty html. We’ve had customers using our API’s for a while but the docs were hosted on a Github wiki page and weren’t very friendly or nice to look at. Since making the docs better we’ve had more people build things!
With the growing popularity there came a sense that perhaps our unit tests weren’t enough any more. The API’s can be broken by more than just a bug in the code. We have Nginx, various internal services, databases and load balancers that could all play a part in ruining someones cool integration. Also, the tests we have currently, and even the app itself which uses the same public API, possibly wouldn’t be making exactly the same calls that I’d documented.
I wanted something that would test the docs and actually do what the users would be doing when following them on production!
So I decided to write some monitoring scripts. After investigating a bunch of frameworks for API testing I took the Joe Armstrong (Erlang dude) approach of deciding against using any framework magic. Writing the tests in pure Python using the requests library looked clean and concise and would be extremely easy to troubleshoot and update in future.

https://gist.github.com/sacreman/32ef355f9ec52ac6acf8
It didn’t take long to write a check script per API end point. They all got written in Outlyer in the staging account initially and were left to run for a while before promoting the scripts into the production account.
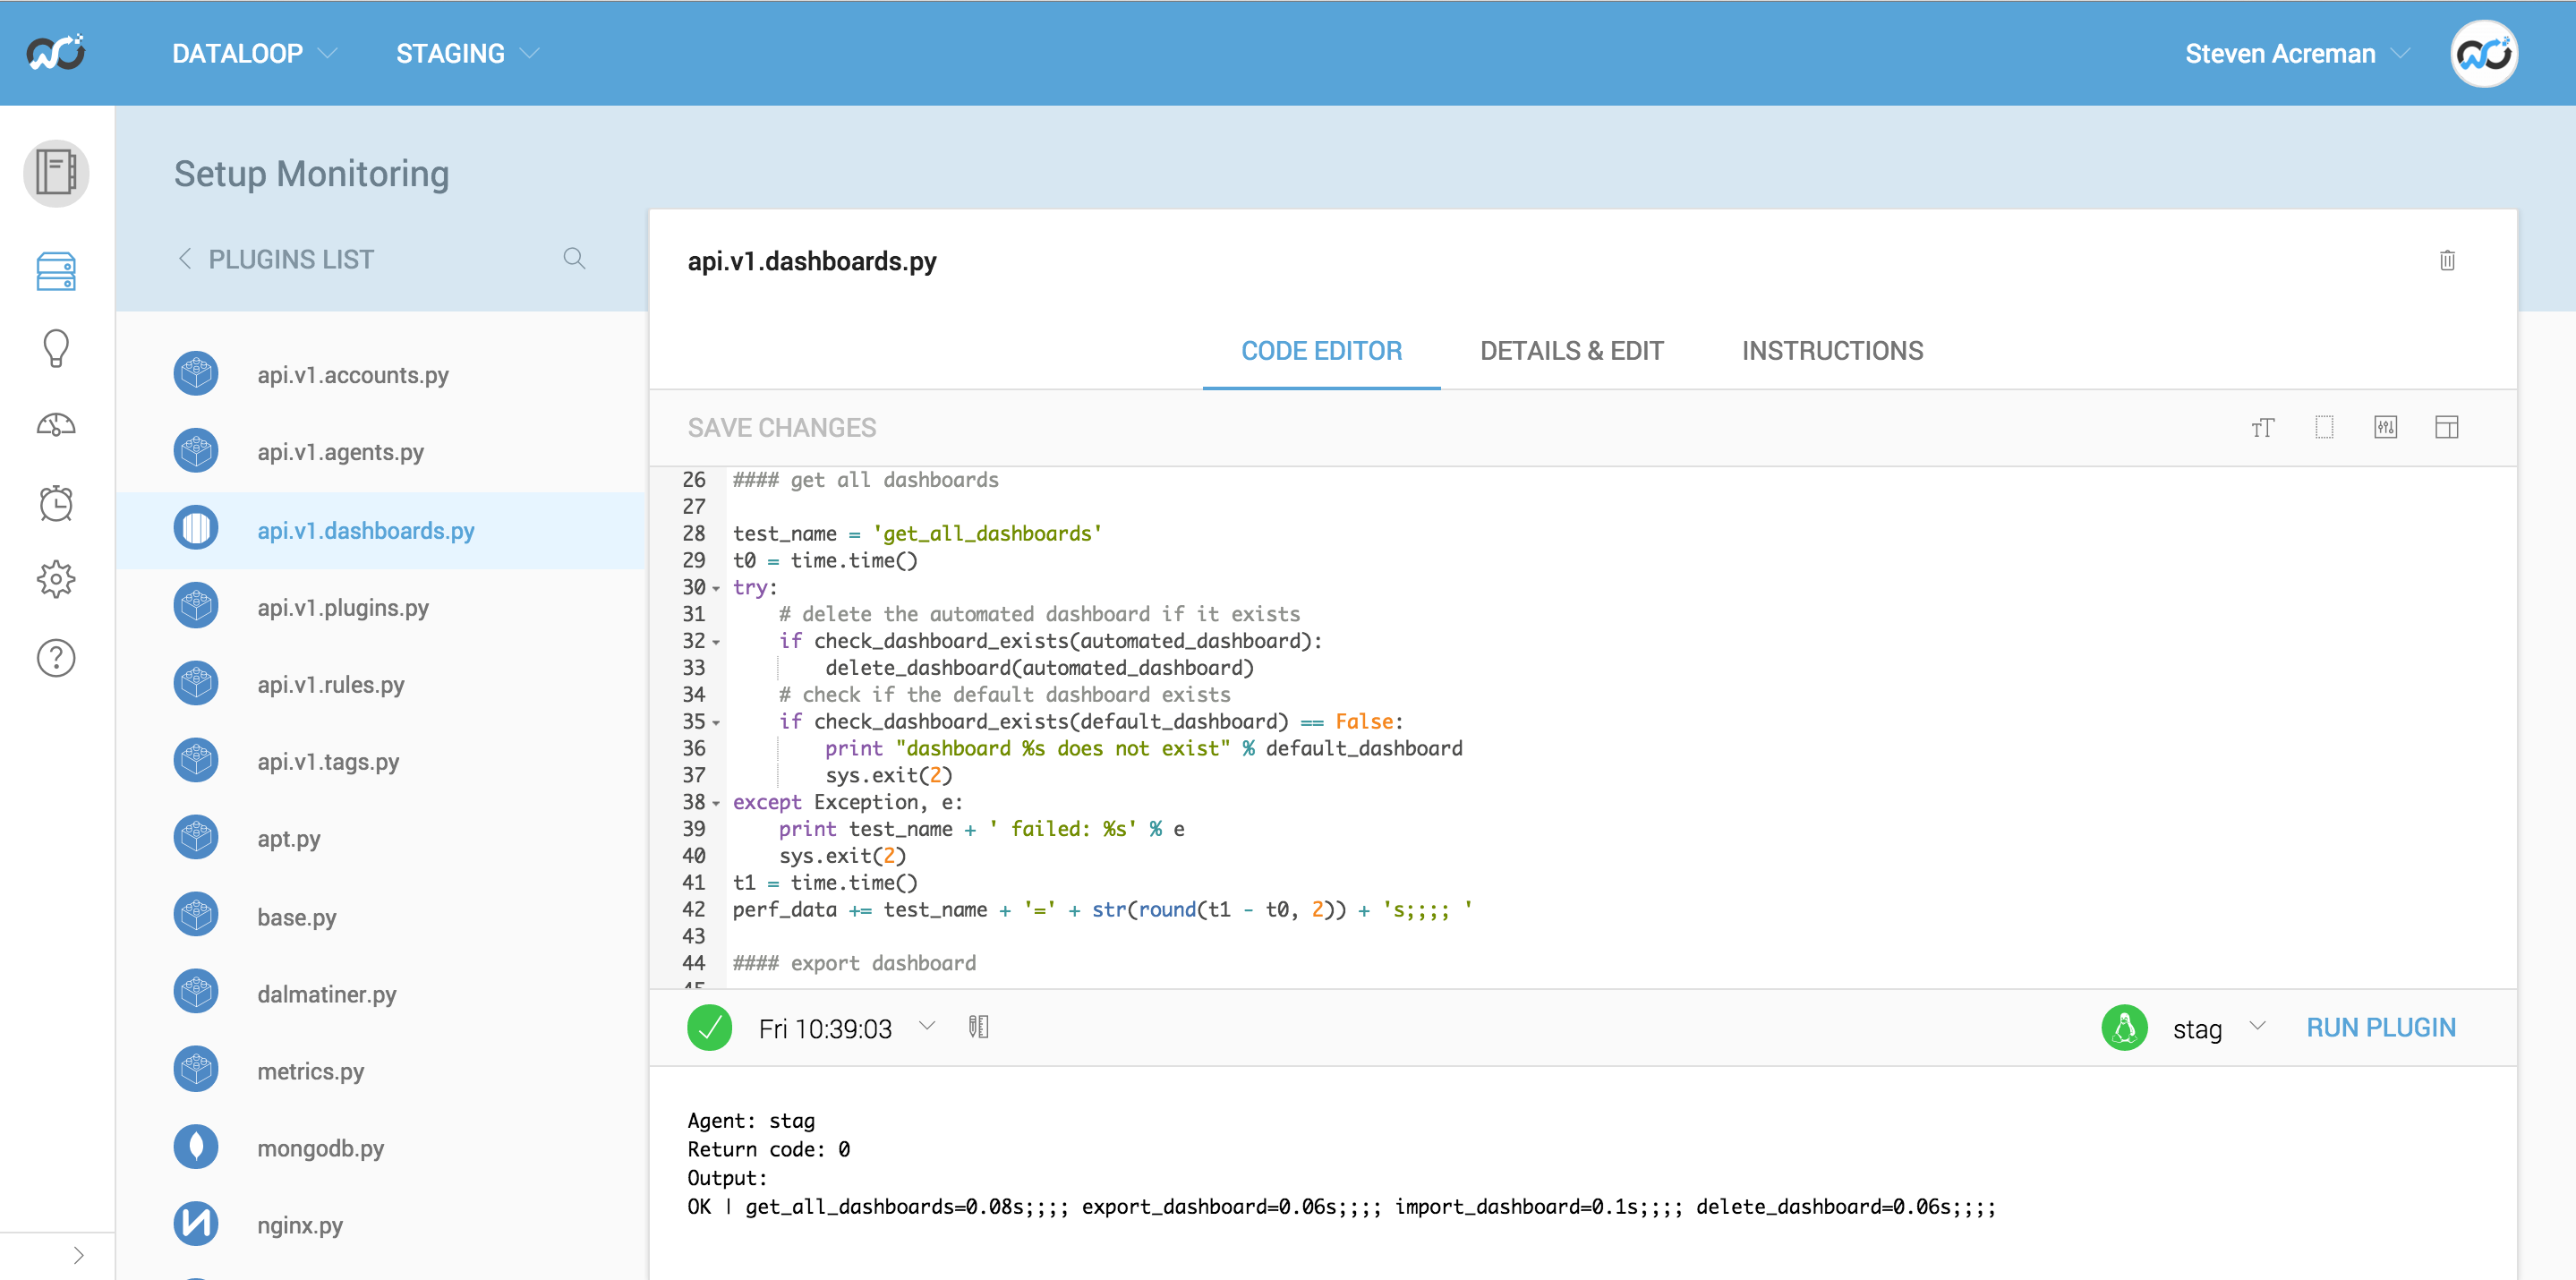
To give an example of what the api.v1.dashboards.py does here’s some pseudo code:
- Get a list of all dashboards and confirm we get a valid JSON response back and cleanup after any failed previous runs (delete the automated dashboard if found)
- Export the default dashboard, parse the YAML and check the title
- Import a new dashboard called automated and verify the JSON via a get request
- Delete the automated dashboard and verify that the dashboard is gone
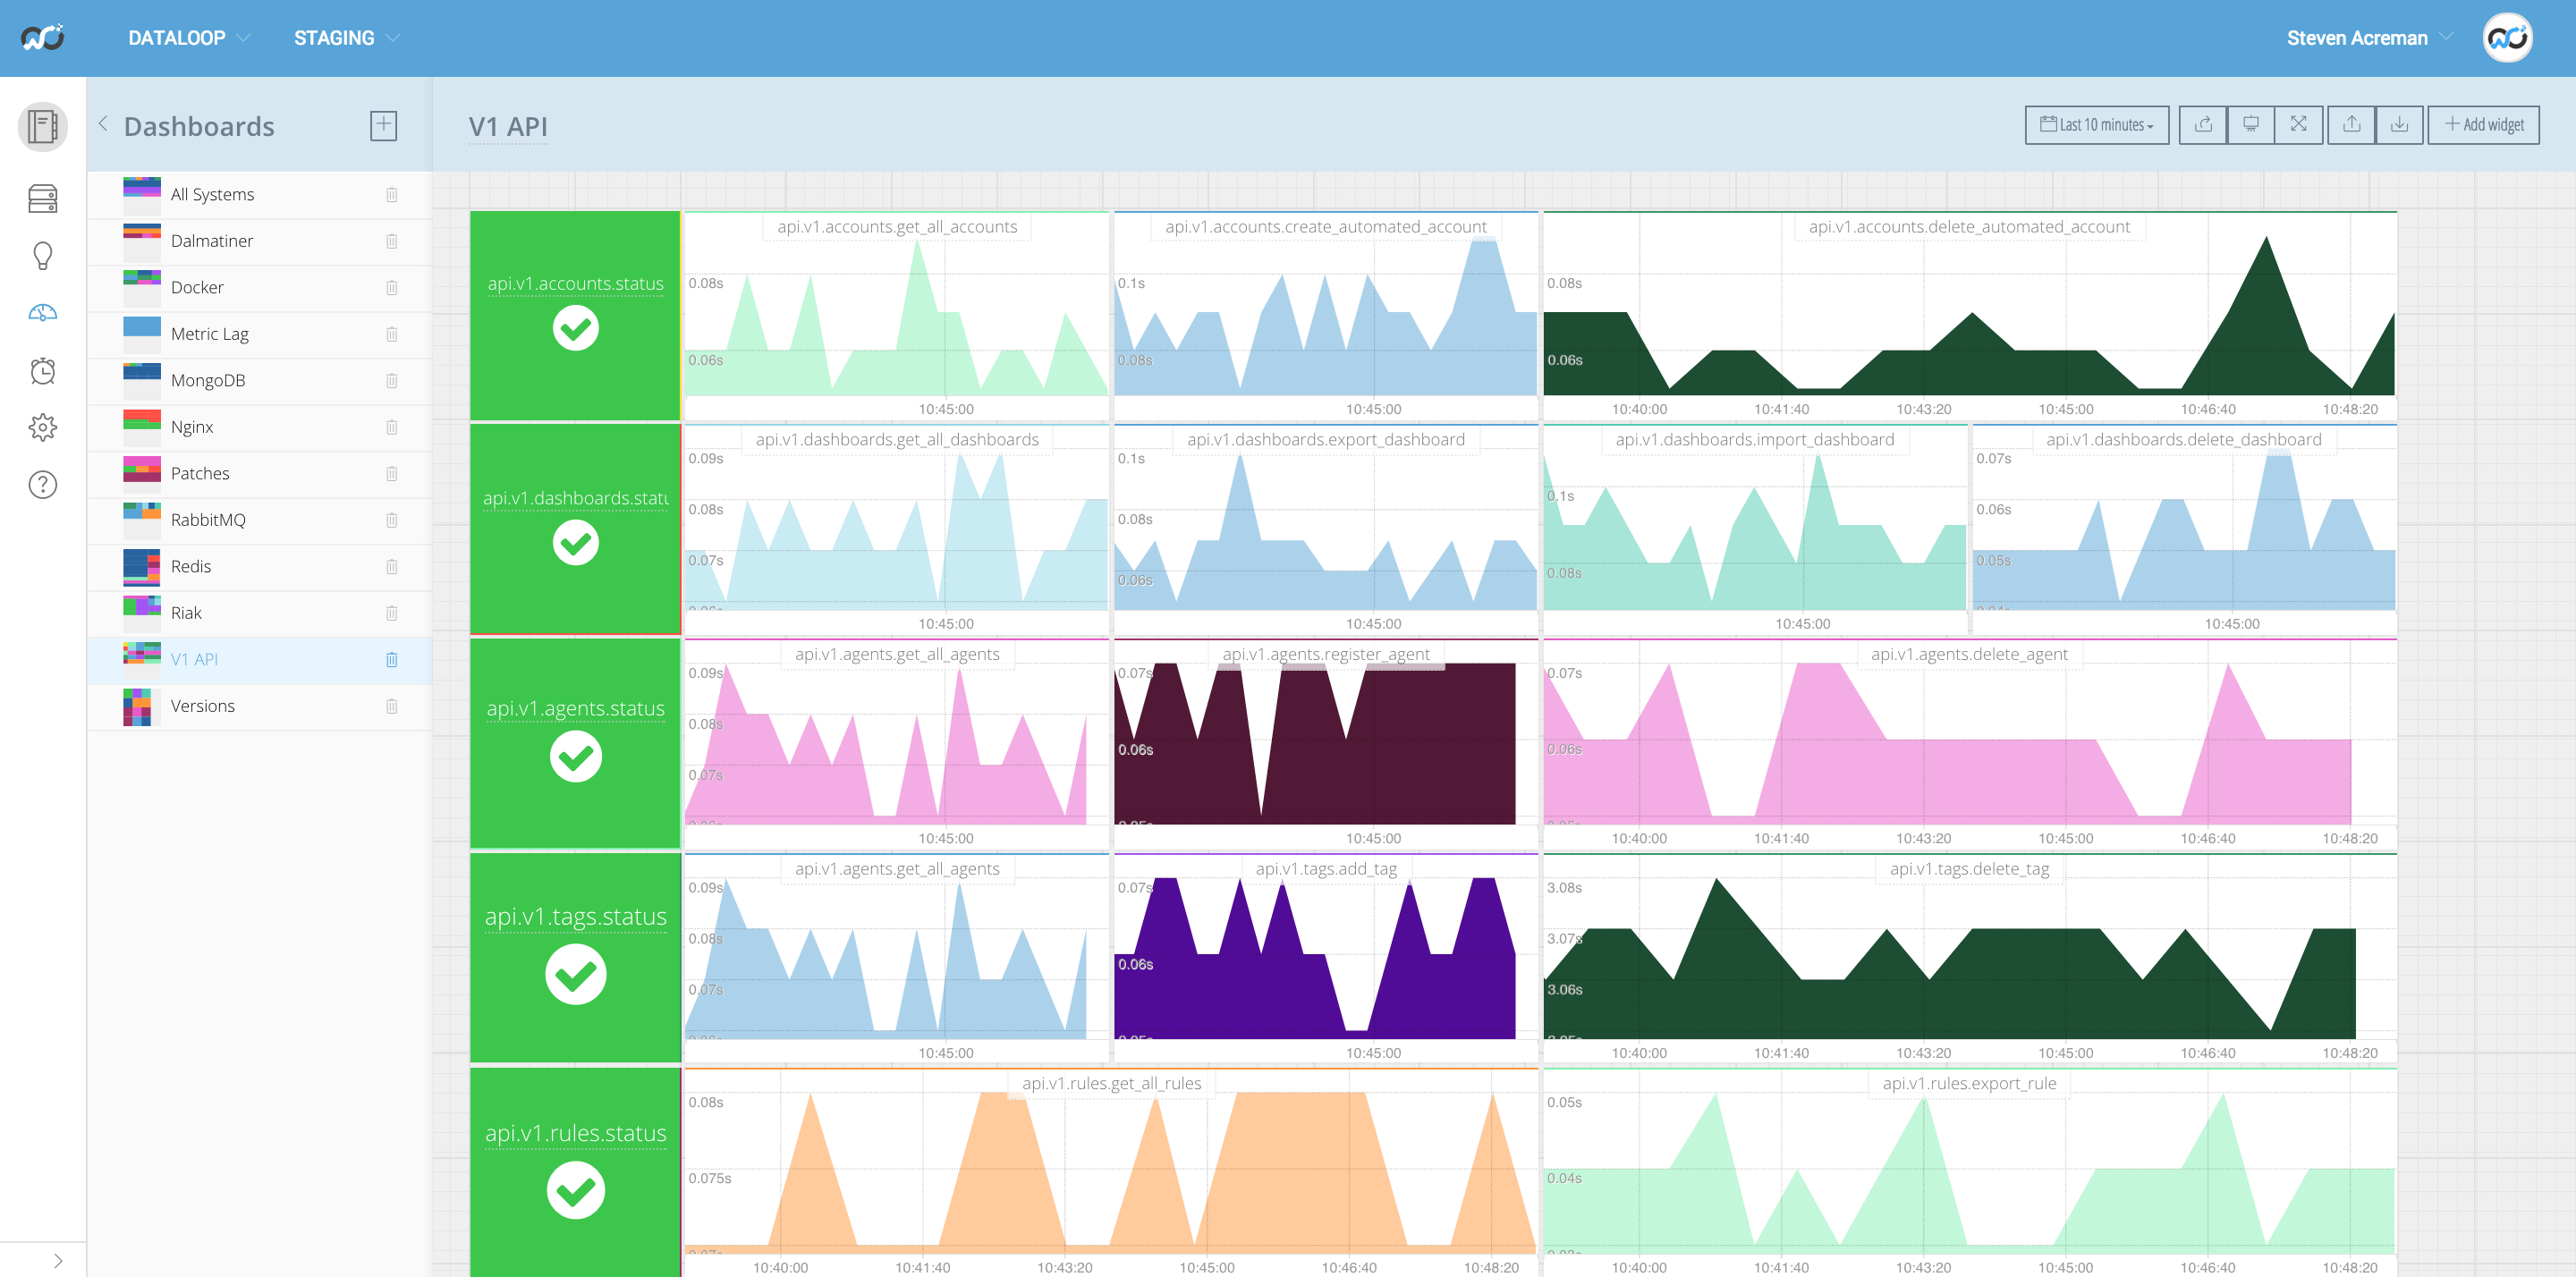
There are 4 commented sections in the script and each section uses exactly the same Python code as written in the API documentation. It also has a bunch of verification code around the outside which exits out of the script with a return code 2 (Nagios Critical error) if anything fails so alerts can be setup. Each section is timed and outputted in the performance data for graphing on dashboards.

This all runs against the same load balancer that users hit when using the API. Everything is currently very fast (a few milliseconds) but if we do ever have any performance problems in future I now have a dashboard I can look at. Or setup threshold alerts to notify if things become slow.

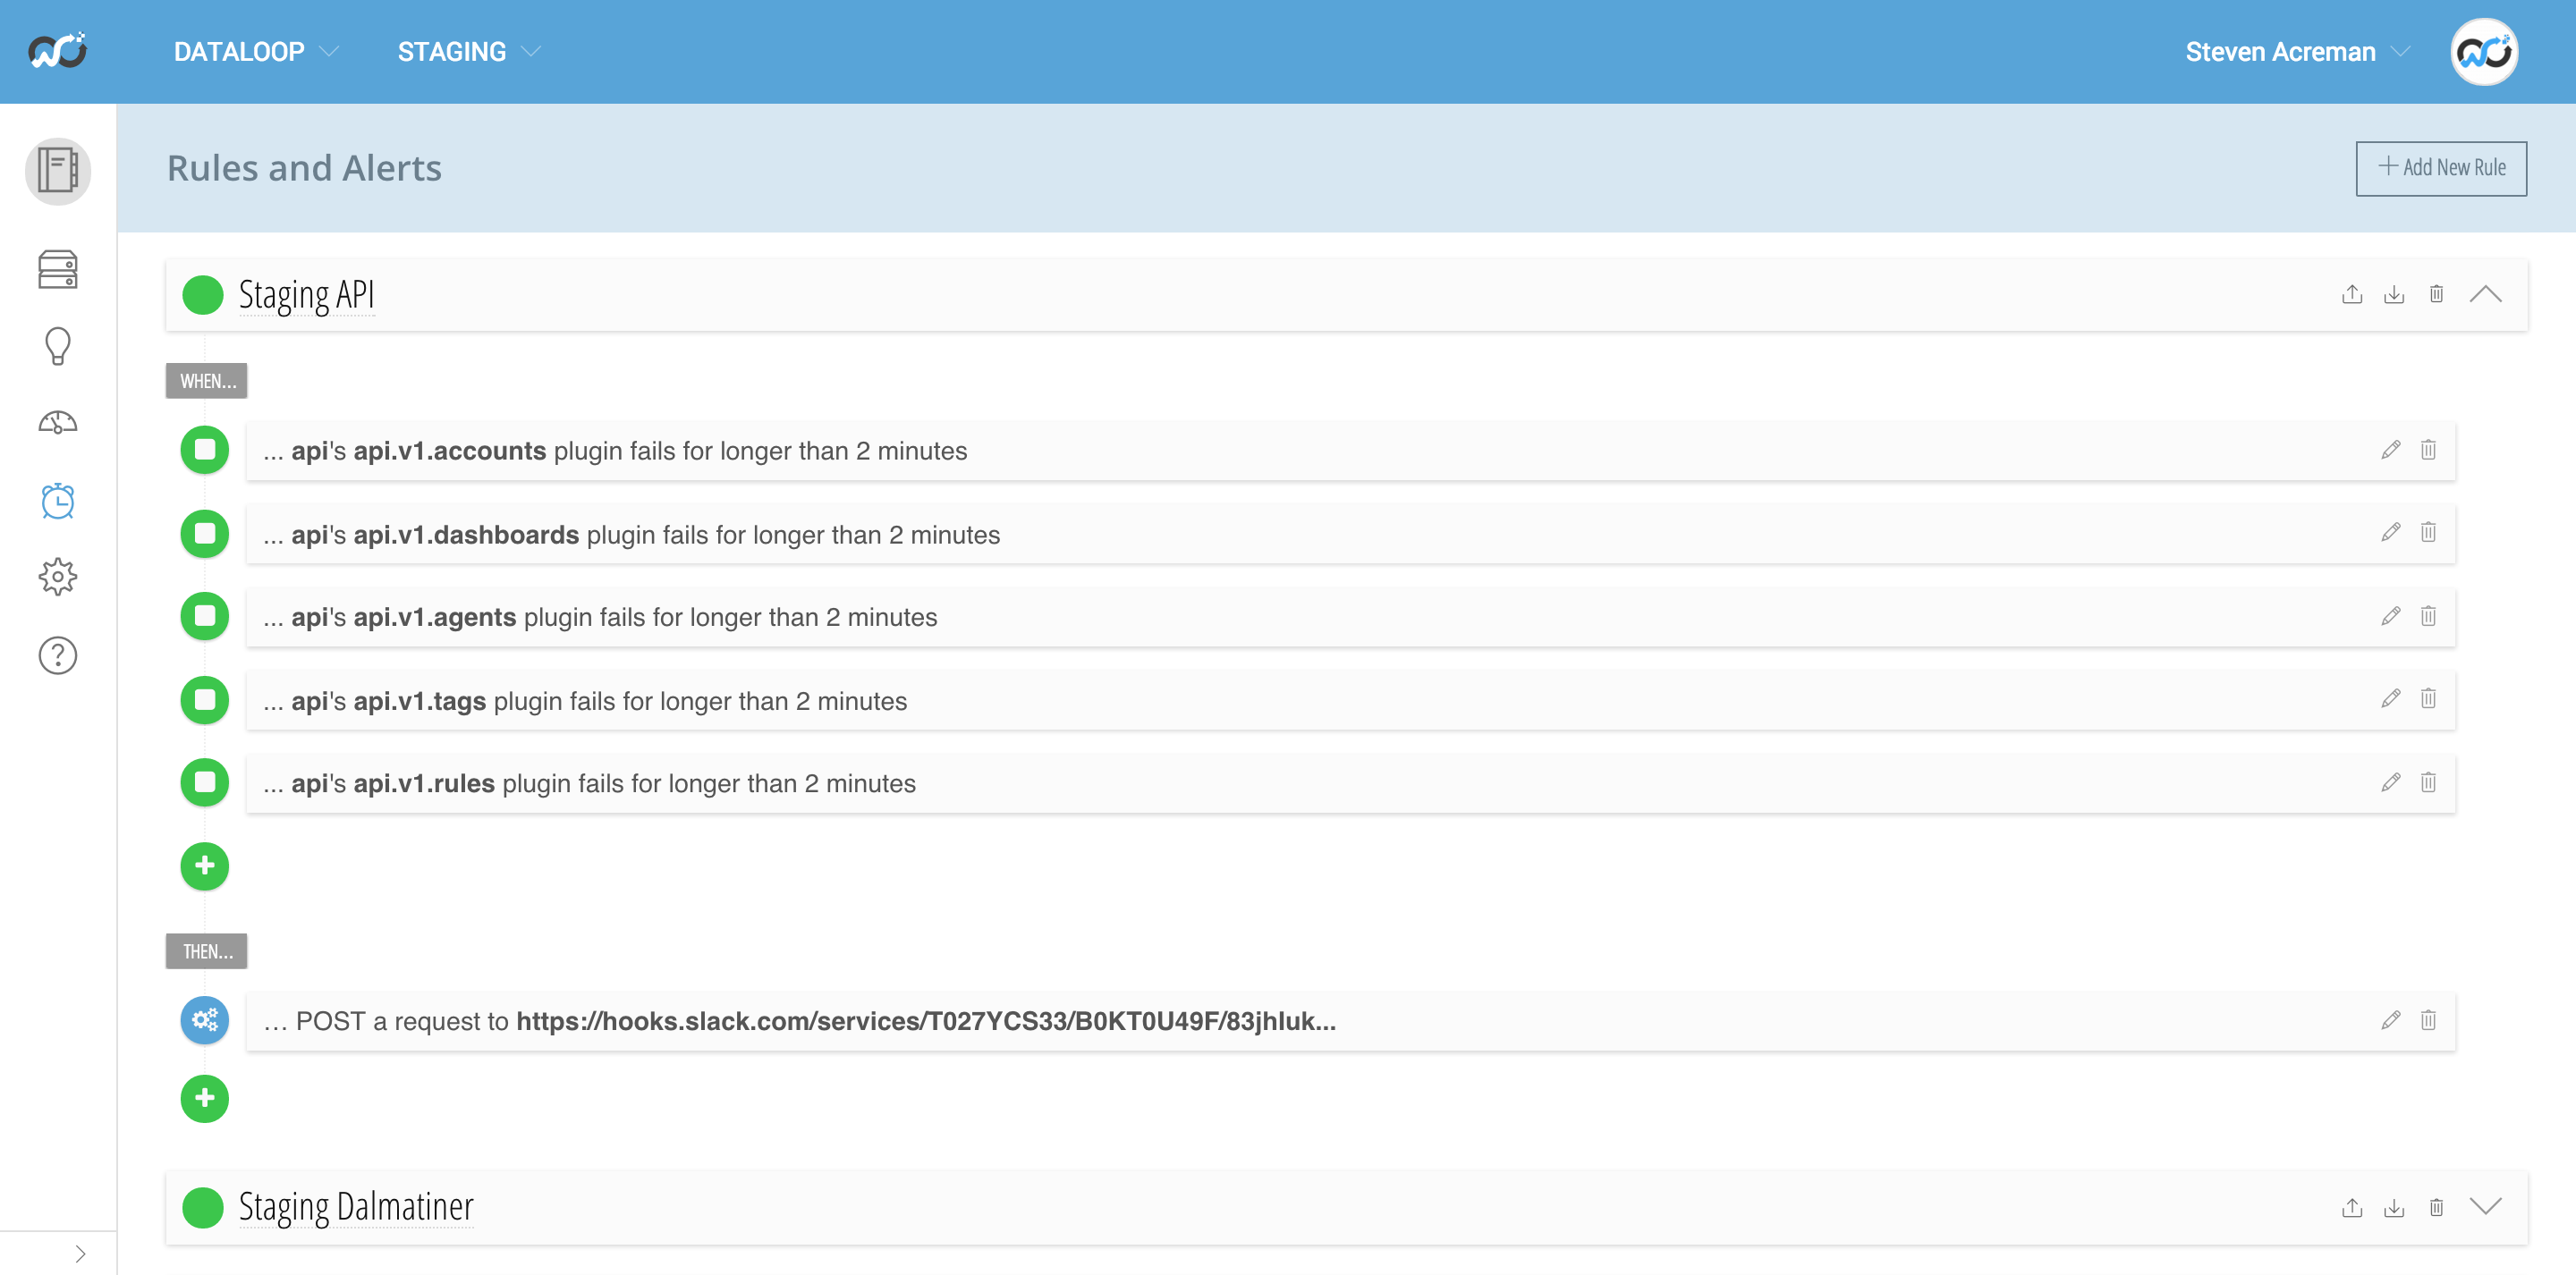
Currently we just have alerts setup on check script failure which catches when the API’s are broken. Our Staging alert rule simply puts a message into our Staging Slack channel.

It didn’t take long for Colin to trigger that and fix the problem before it hit production. The production rules send an email to our group, put a message in our alerts Slack channel and trigger Pagerduty to wake people up.
Overall it has been a pretty fun experience. Writing API docs in markdown and using Slate has been a joy compared to writing blogs in Wordpress or support docs in Zendesk. Having check scripts that hit the API every 30 seconds and warn me if anything has broken in the API has greatly increased my confidence that our users can build things and not get annoyed.
All in all it only took a few hours and as we iterate our API’s the task of keeping the monitoring updated isn’t too arduous. In the future we intend to implement Swagger which provides a bunch of stuff to help test and document API’s. But for now I’m pretty happy with our Slate and Python setup!