As everyone starts moving into deploying their services on Kubernetes, a lot of our new users ask us how we compare to Prometheus. For those of you who aren’t familiar with what Prometheus is, Prometheus is an open source pull-based monitoring tool that scrapes HTTP endpoints that expose dimensional time series data collected from hosts, services and applications. Since it was designed for dynamic environments and microservices, it became the official open source choice for Kubernetes monitoring.
Let’s take a quick look at the Prometheus architectural diagram:
 Prometheus Architecture
Prometheus scrapes metrics from various targets on a predefined time interval, stores them in a local on-disk time-series database, and lets you query them with a functional expression language (PromQL). Targets that don’t expose their metrics in the Prometheus format (most technologies that your company are already using such as: MySQL, Nginx, Redis, Cassandra, Kafka, Elasticsearch, MongoDB, etc) must run a Prometheus sidecar exporter in order to convert native metrics into Prometheus formatted metrics. Alerting is handled by Alertmanager and dashboards are built on top of Grafana (which provides a native Prometheus data source). For collecting metrics from short-term jobs, another component named Pushgateway is used.
Differences between Prometheus and Outlyer
While Prometheus is a great open source tool, it also has its drawbacks. Let’s list them out and compare with Outlyer.
Hard Setup and Maintenance
As you can see from the Prometheus architectural diagram, its setup involves many different components as well as exporters for most of technologies you need to monitor. This is not trivial and requires full-time attention from your operations team in order to make it work properly.
From talking to lots of companies that have started on Prometheus, because of the steeper learning curve and more complex architecture, getting Promtheus into production, especially if you’re running at scale, can take up to 6-12 months in some cases, as we’ve discussed previously here.
Outlyer, on the other hand, is a Software-as-a-Service (SaaS) offering, which means the setup and maintenance efforts are nearly zero - you just create your account and start using it.
Limited Scalability
Prometheus storage does not offer clustering capabilities, which puts a hard limit on the number of metrics that can be monitored by Prometheus.
The official Prometheus scalability guide recommended in the Prometheus documentation states the following:
This (horizontal scalability) is a more complex setup and is much more involved to manage than a normal Prometheus deployment, so should be avoided for as long as you can.
Outlyer was designed for massive scalability, and the best part is that this is on us so you don’t have worry about it.
Lack of Long-term Storage
Prometheus’s built-in storage does not support long-term data retention and durability. If you need to store your data longer, you will have configure, deploy, maintain, and integrate a third-party storage system like Cortex, CrateDB, InfluxDB, or others to your existing Prometheus setup.
Outlyer keeps all your metrics for 13 months allowing users to do capacity planning for the past year and compare month on month trends.
Lack of Security
Prometheus and its components do not provide any server-side authentication, authorization or TLS encryption.
If your company needs security you will have to configure, deploy, maintain, and integrate (at least) another component to your existing Prometheus deployment, such as a Nginx reverse proxy.
In Outlyer, not only all communication is encrypted with TLS but also it offers out-of-the-box user management, including multiple users joining a single account.
Monitoring a New Service is Not Straightforward…
In Prometheus, for each new technology your team needs to monitor, the setup process will require at least 4 manual steps:
- Deploying an exporter and its configurations, which can look very ugly and error-prone as you can see in this Kafka exporter configuration
- Updating configuration on Prometheus so it can pull metrics from the exporter
- Setting up a community dashboard or creating one by yourself. Open source projects may be great for technology, but can be awful for UI. Compare it yourself:
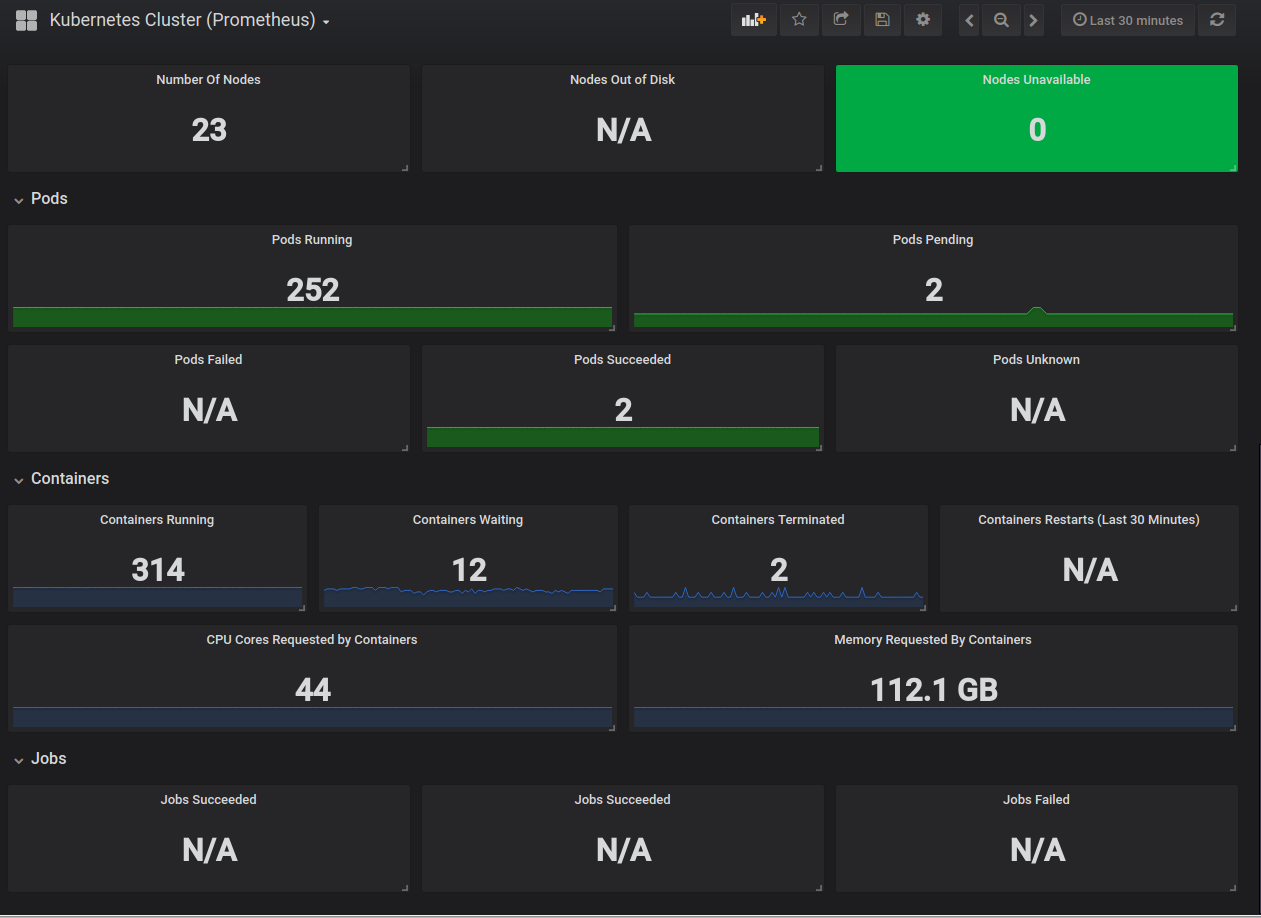 Prometheus Kubernetes Dashboard
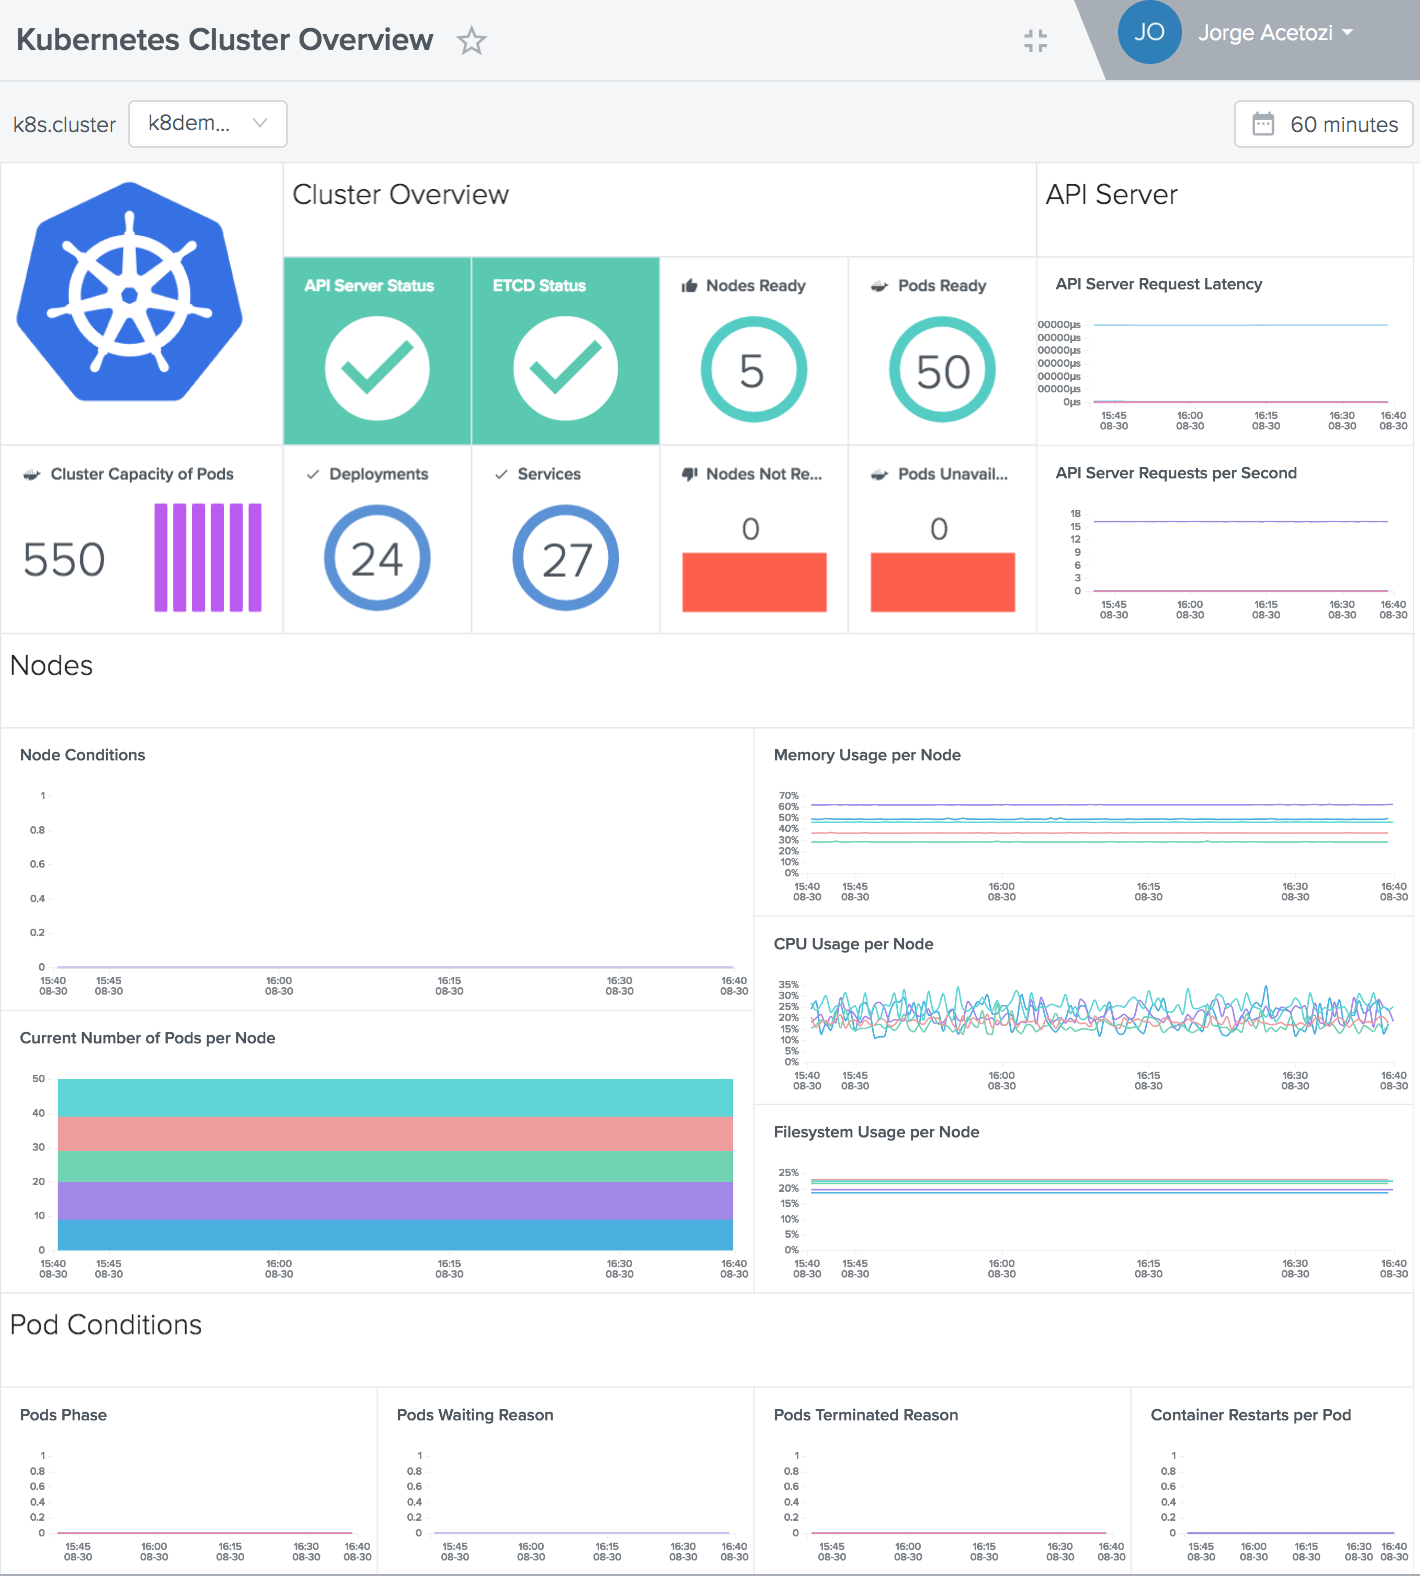 Outlyer Kubernetes Dashboard
- And finally, defining and setting up alert definitions on Alertmanager
In Outlyer, monitoring a new technology is as easy as installing one of our one-click-install integrations. For example, in order to install a complete Kubernetes monitoring, all you need to do is navigate to the Integrations UI, find the Kubernetes integration and click on Install:
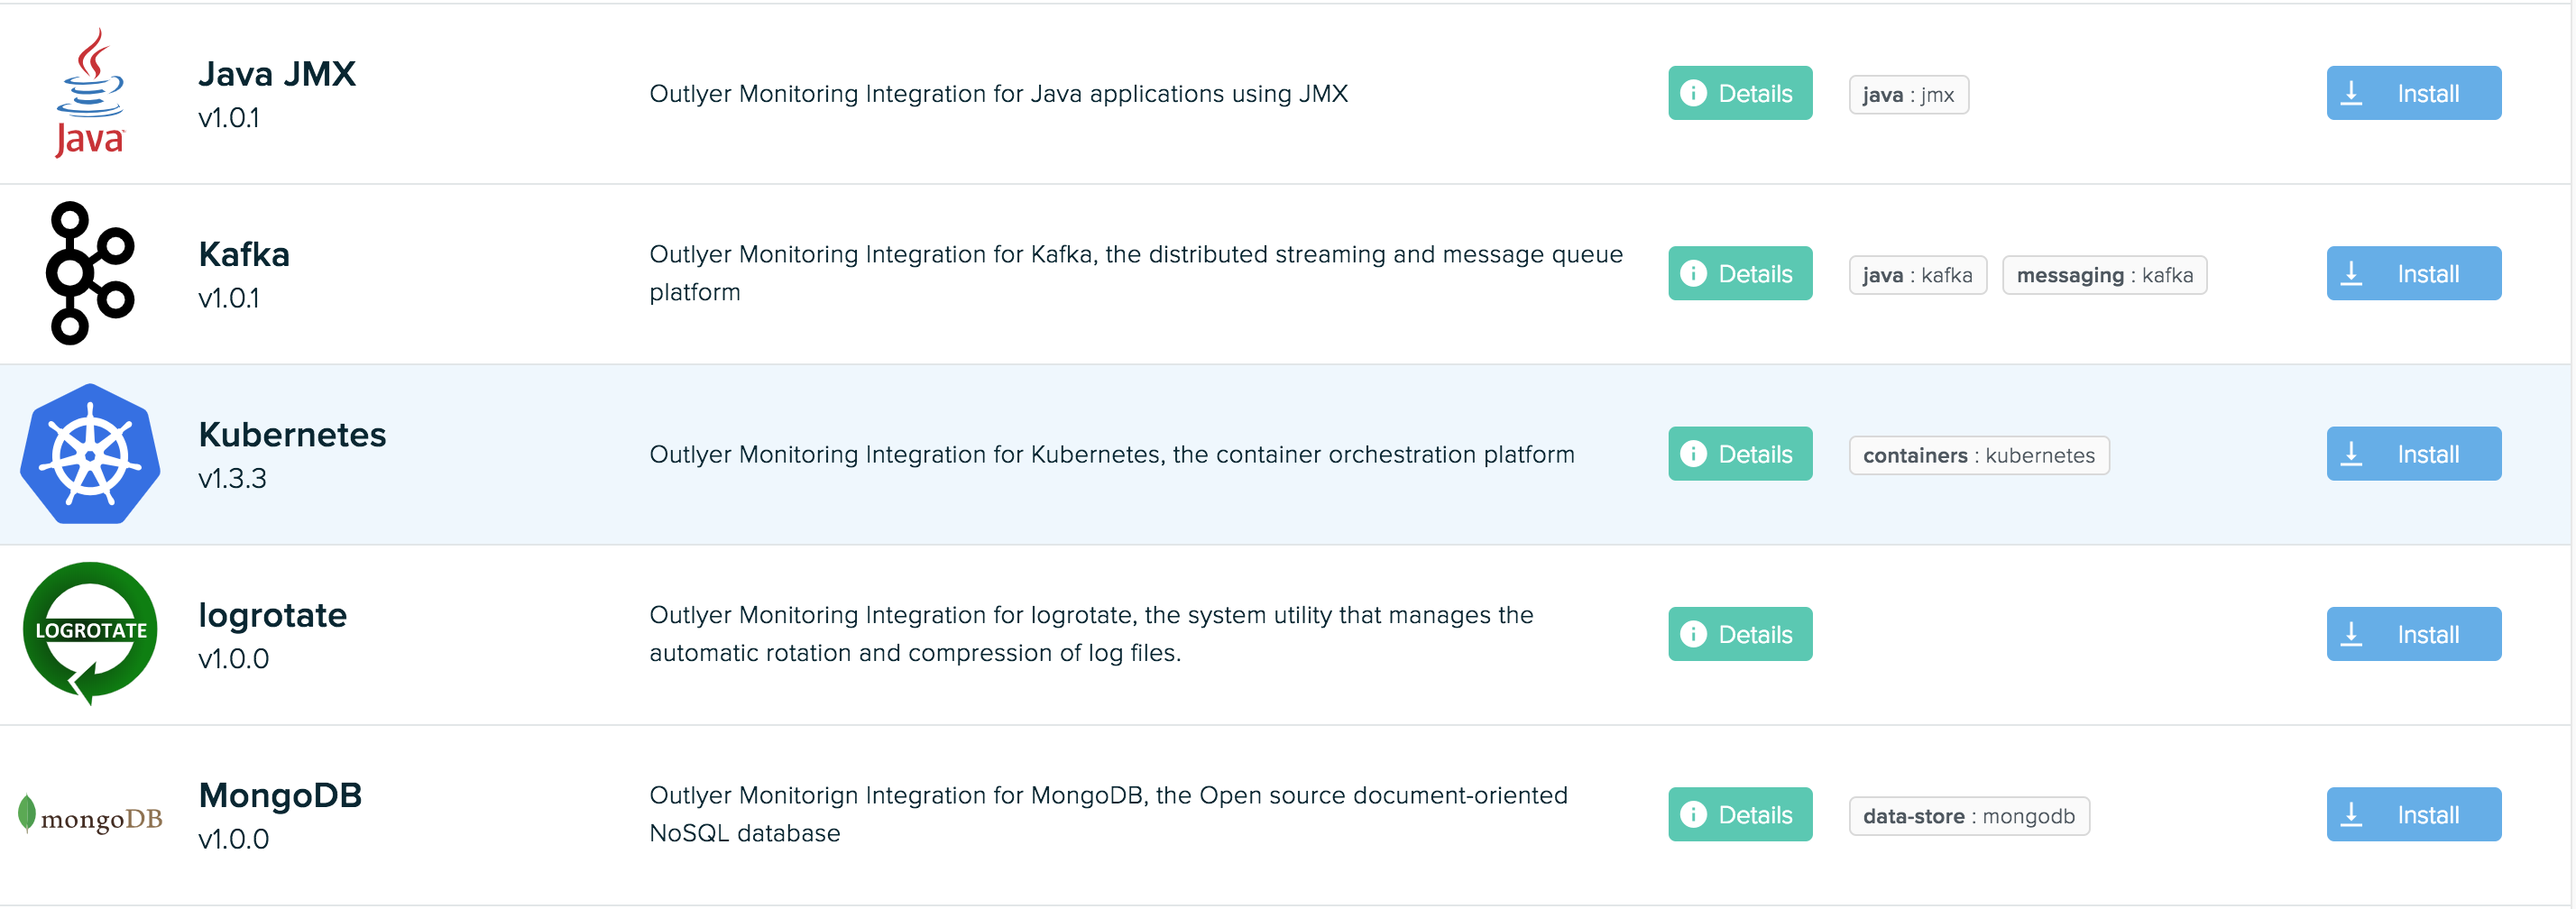 Install Kubernetes Integration
Then, pick the appropriate selectors and click Create:
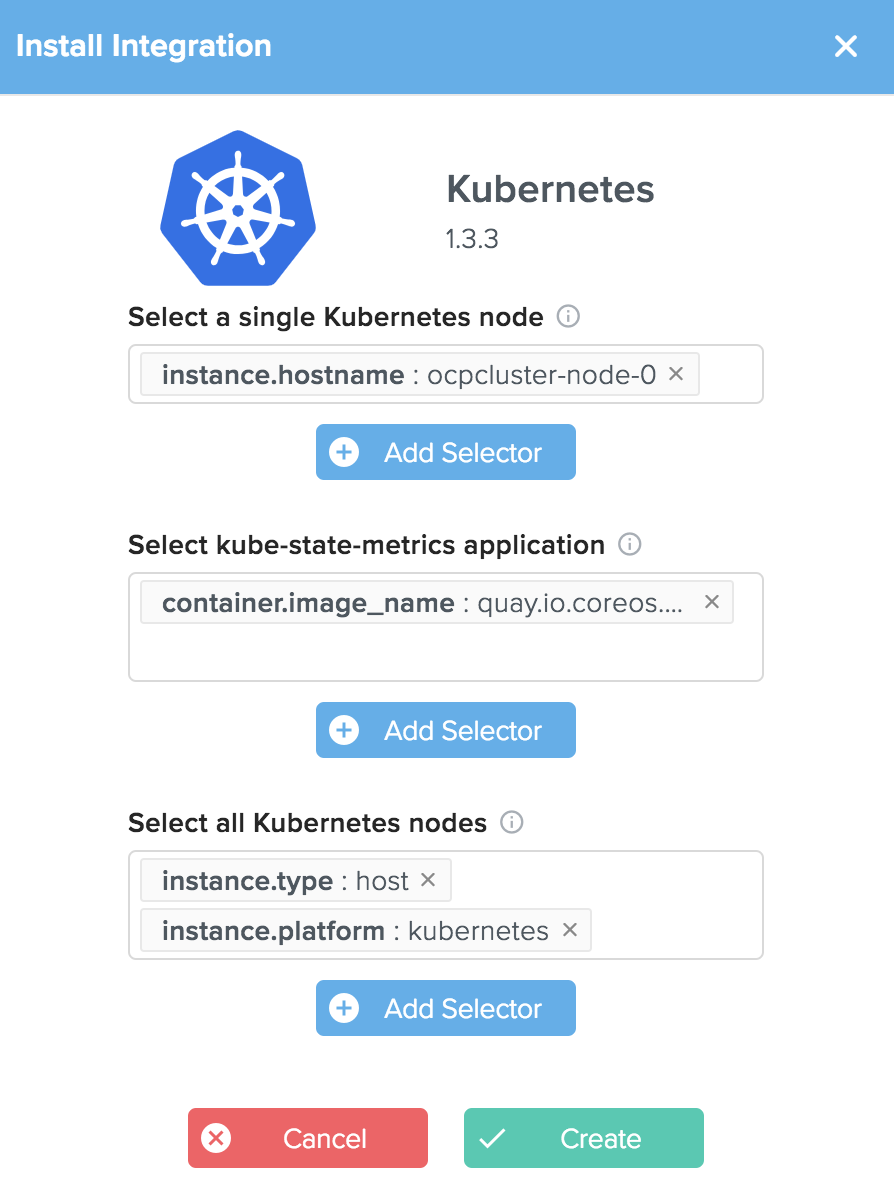 Kubernetes Integration Selectors
It’s done! Now your Kubernetes cluster is being fully monitored and you can focus on your business to delivery value to your customers. Speaking of Kubernetes, our integration seamlessly works on every type of Kubernetes deployment: EKS, GKE, AKS, IBM Cloud, OpenShift, on-premises, etc. In fact, as Outlyer is a Red Hat Container Certified Partner, we also offer an OpenShift-specific integration for OpenShift Container Platform.
…Which Makes It Harder To Roll Out Self-Service
While a lot of developers eventually figure out how to setup exporters for their own services, because of the steeper learning curve, we’ve had several larger companies approach us as they want something completely self-service, that can offload all the setup work to the developer teams instead of the Operations team trying to get them all to setup Prometheus exporters by themselves (and failing) resulting in a central Operations team still having to take on the burden of deploying and maintaing all the monitoring across the service.
Outlyer is fully self-service out of the box. You just invite developers in who can setup monitoring in just a few clicks without extensive training. They can also write custom integrations themselves directly in our platform too, changing the conversation from “Can you setup monitoring for us” to “Just do it yourself”, a far more agile and scalable way of getting monitoring rolled out across your services.
Can Outlyer Scrape Prometheus Endpoints? What About Prometheus Pushgateway?
Absolutely! Outlyer offers a one-click-install Prometheus integration which you can use to ingest metrics from both Prometheus endpoints and Prometheus Pushgateway. Please refer to this guide for a practical example.
What Else Outlyer Offers?
Outlyer offers many other relevant features not present in Prometheus, like the ability to export your entire configuration via command-line. Let’s have a quick look at some of them.
A Modern User Interface
The Outlyer UI is sophisticated and actively maintained by our team to ensure great usability for our customers. You can configure everything from the Outlyer UI, avoiding having to deal with different components for different tasks. As opposed to with Prometheus Alertmanager handles alerts, Prometheus handles scraping configurations, Prometheus Gateway handles metrics from short-term jobs, a third-party external reverse proxy handles authentication, and so on.
Status Views
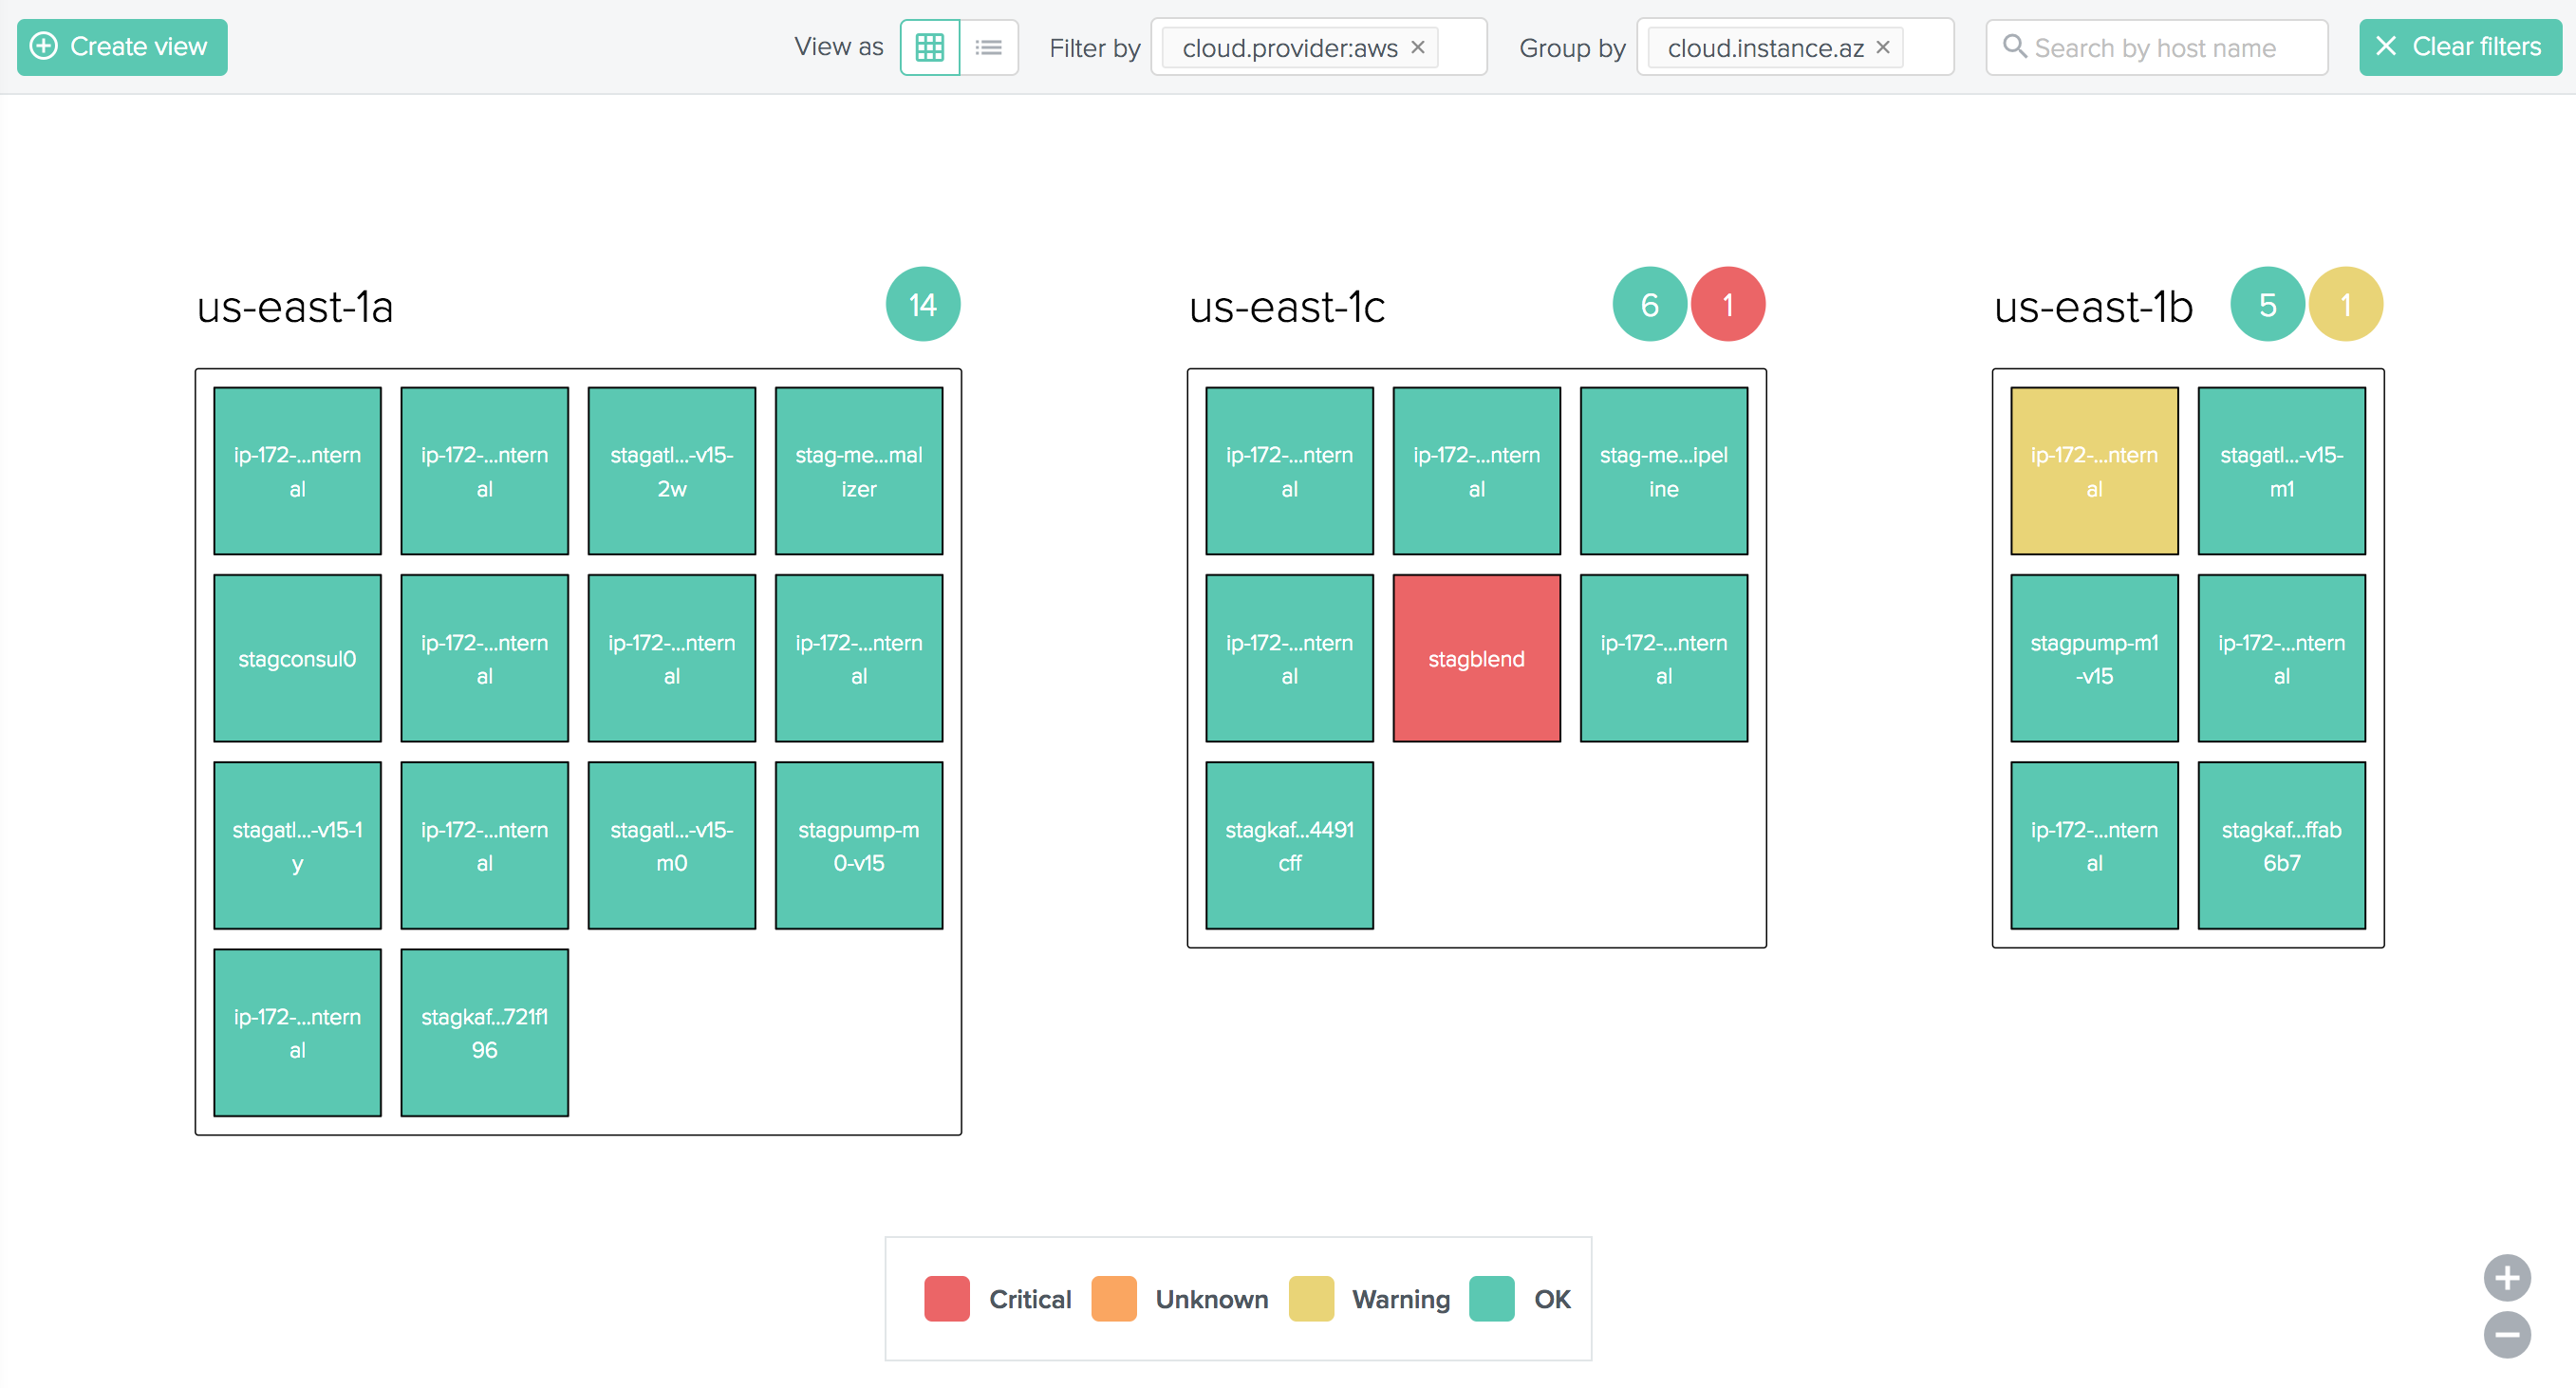
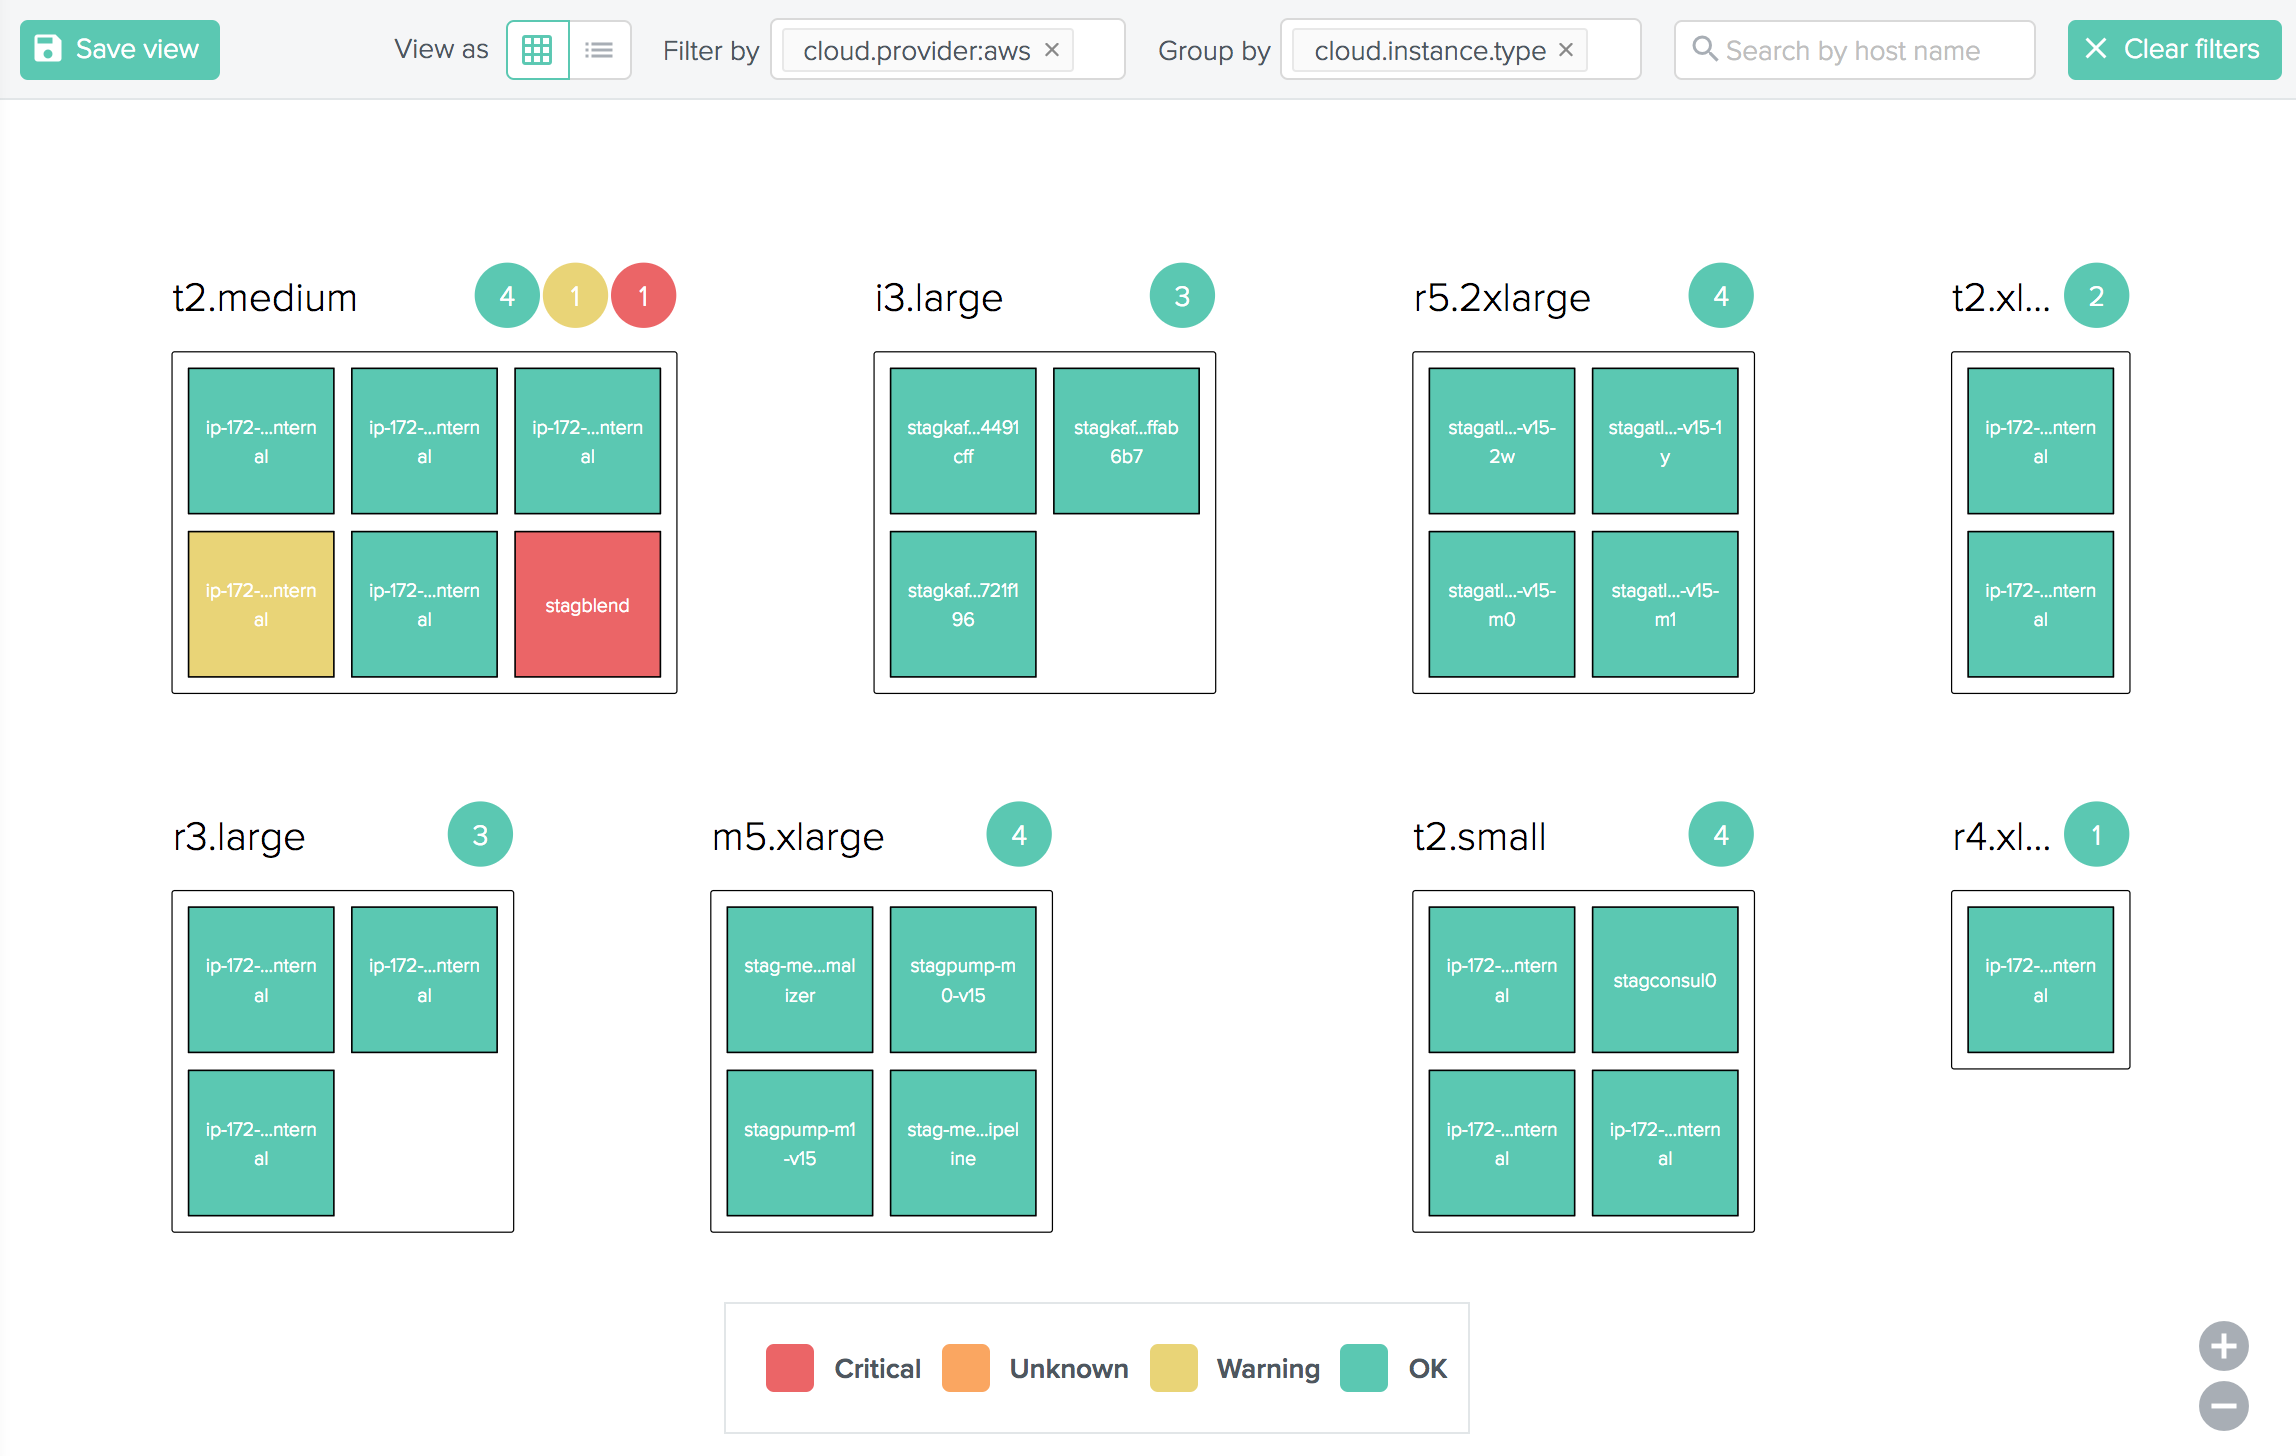
Outlyer Status Views provide full-visibility on all of your hosts and containers on a single screen. By filtering and grouping your hosts and containers, you can create, save, and export highly customizable views, such as all of your AWS instances grouped by availability zone:
Or even all of your AWS instances grouped by type:
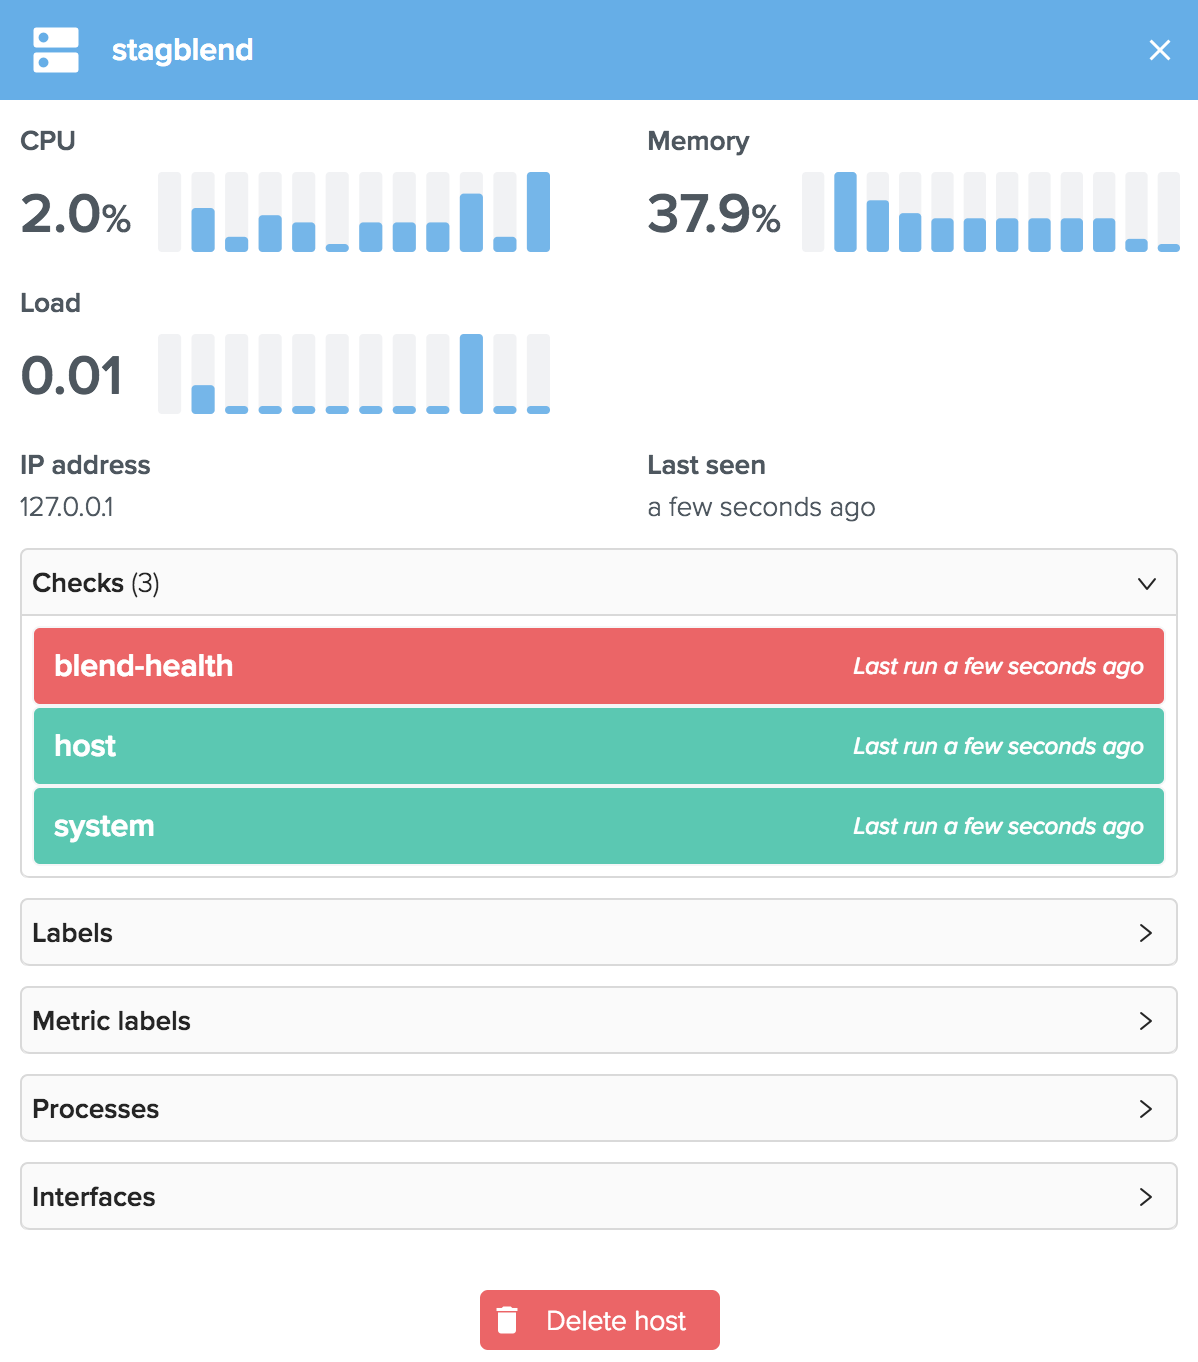
Clicking on a host gives all its details categorized by host metrics (CPU, memory, etc), checks, labels, metric labels, processes, and network interfaces:
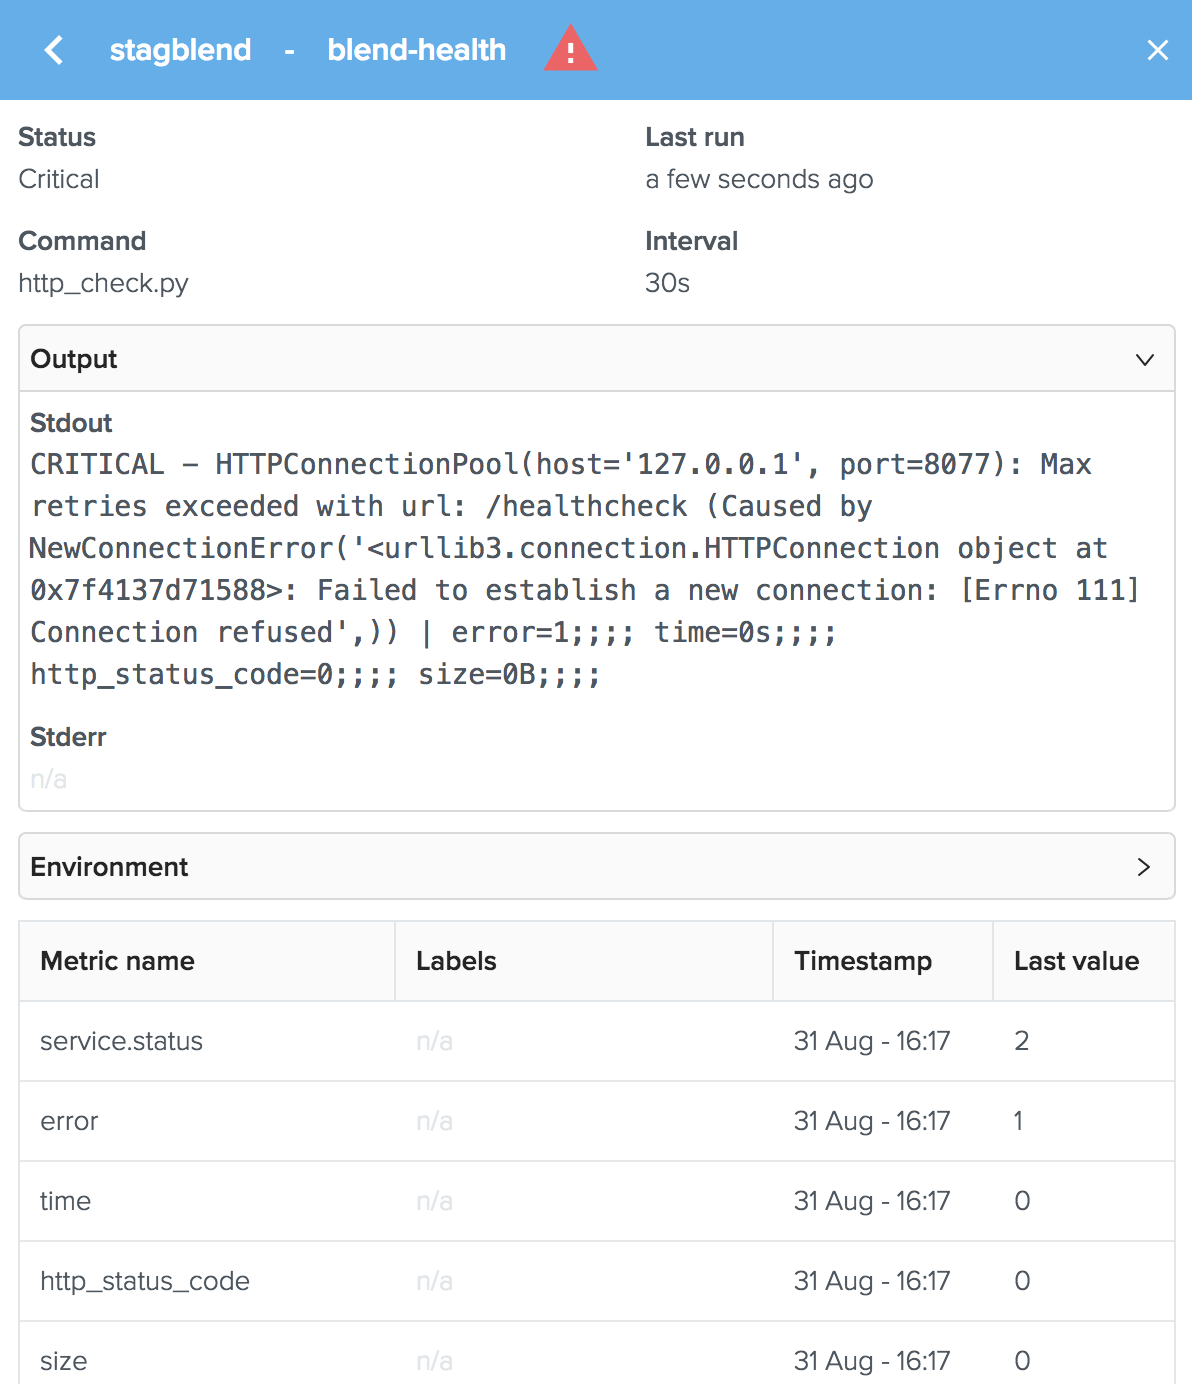
This allows you to quickly identify failed checks and see why they are failing in a single click:
Please refer to our status views documentation for more details.
Dashboards
Our dashboards are highly customizable and allow you to easily drag and drop widgets, filter metrics by scope, select time ranges to explore historical metrics for over a year, import and export dashboards, share public dashboards, and much more. The Preview Mode auto-adjusts to your screen size, making it suitable for displaying in a large screen that will look great in your office.
Please refer to our dashboards documentation for more details.
Alerts
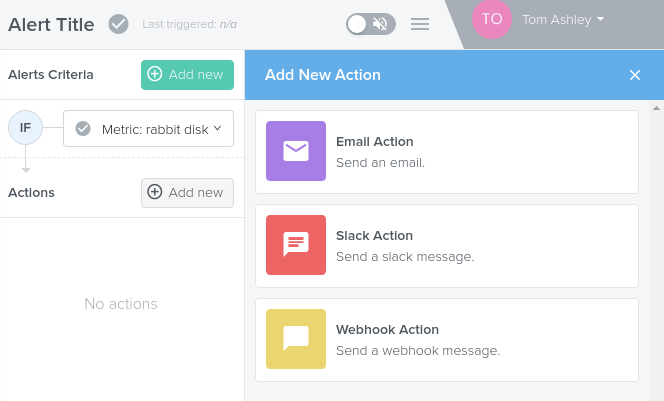
In Outlyer, alerts are easily created in the UI and notifications can be configured to be sent to a variety of destinations, like email, Slack, or a predefined webhook.
Custom Plugins
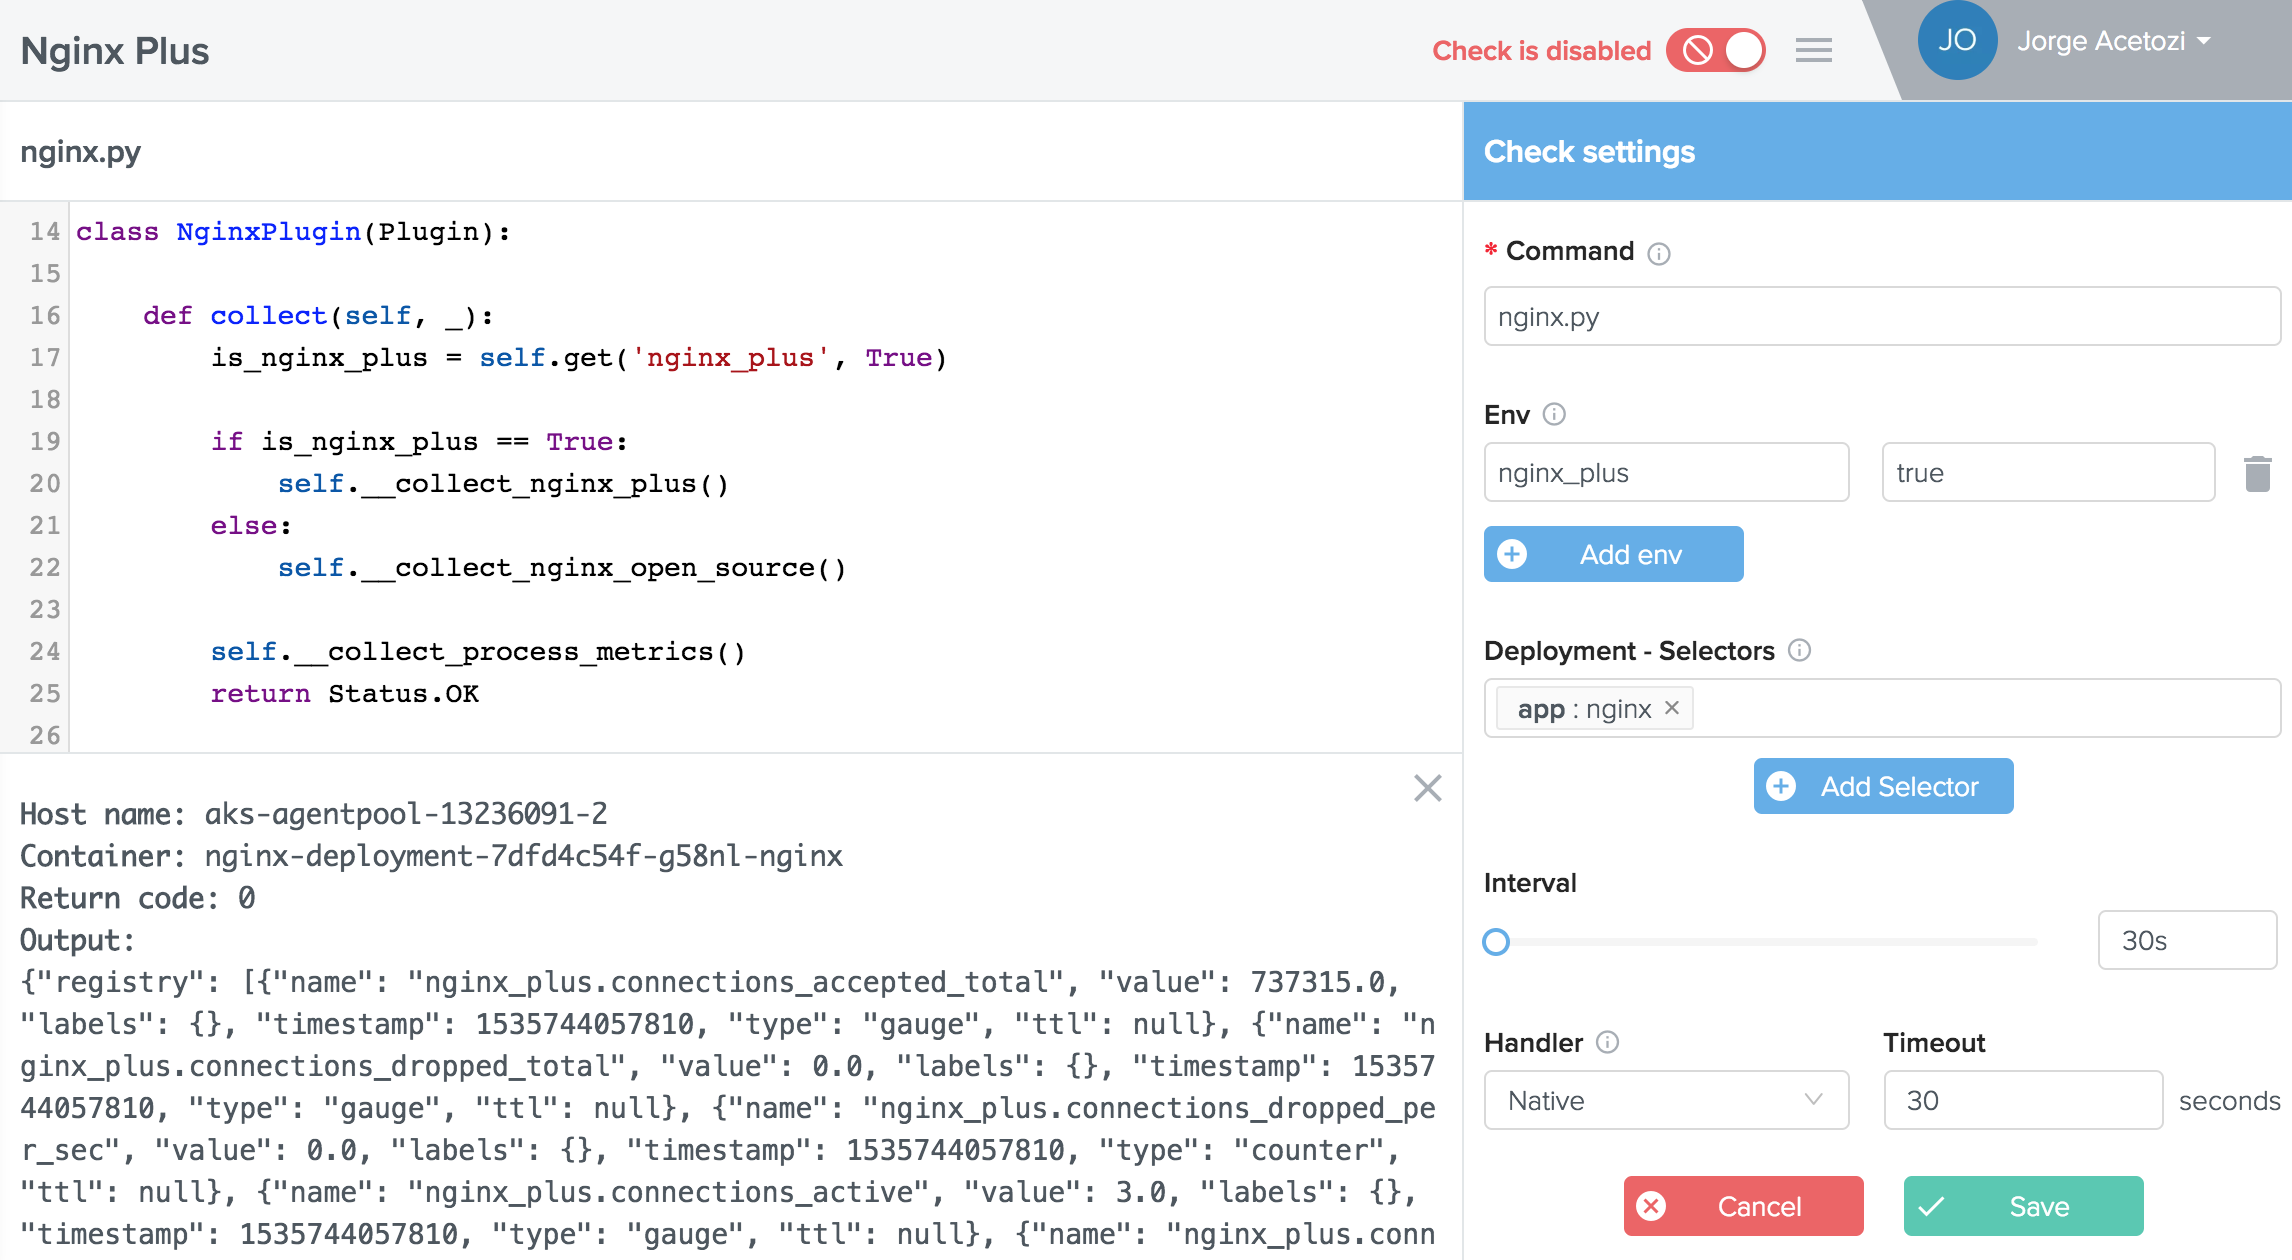
If you need to collect custom metrics, Outlyer allows you to create and test your plugins directly from the UI, which makes the development process much easier. As soon as your plugin is ready, just enable it on the top menu and it will get automatically pushed to the selected agents with no need for restarts:
Configuration as Code
The Outlyer CLI is an open source project that enables users to import and export their entire Outlyer account configuration as a local folder structure and YAML files. This allows users to support several use cases:
- The ability to update and edit account configuration via code and push updates when performing releases
- The ability to version control all account configuration via Git
- The ability to export all check/plugin configuration to deploy to the agent via Configuration Management
Just install it on your preferred platform (macOS, Linux, Windows) and export your entire existing account with a single command:
$ outlyer export . --account=<your_account>
Or create an entire account from a previously exported account:
outlyer apply . --account=<your_account>
Please refer to our Outlyer CLI documentation for more details.
Support for Legacy Environments
Outlyer natively supports legacy use cases such as network device/SNMP monitoring and Nagios checks. This allows easy and native migration from legacy tools without requiring the installation of exporters or any other additional components.
Other Features
Outlyer also offers other features such as a powerful query language, various deployment modes, and remote host discovery.
The Outlyer agent is supported and seamlessly runs on most major platforms: Linux (Amazon Linux, Debian/Ubuntu, RHEL/CentOS), Docker, Kubernetes (all cloud providers and on-premises installations), OpenShift, macOS, and Windows.
Please explore our documentation to see all available features.
Can I Try Outlyer for Free?
Totally! Just click the ‘Try It Now Free’ button below and start using it right now. Please let us know if any have any questions and… happy monitoring!