Prioritise service over features

There is a constant tug of war going on in most SaaS companies. With finite resources you have to make tough decisions on whether to push forward with the feature roadmap or slow down and reduce technical debt that may be contributing to slowness or instability of your app. New features can mean more customers while bad service means losing customers.
Product managers have a natural tendency to prioritise shiny new features over work that needs to be done to help run a successful service. This problem is magnified a thousand times if you work in a company transitioning from product centric development to service centric development. Even when everyone is working in the same team, unless you have data to backup your requests, I wish you good luck getting the priority to fix the non visible stuff.
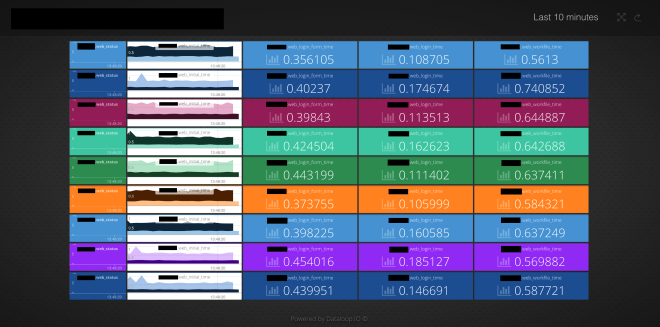
One way to level the playing fields is with data. We’ve seen several examples of operations teams in companies making performance metrics easily visible to other teams, and especially senior management. It’s surprising how quickly login times, or search result performance gets fixed when you start sending out graphs showing how bad things are.
Track Deployments

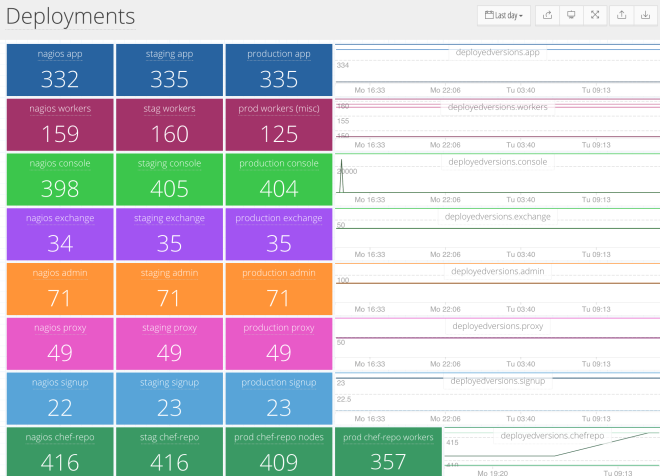
Ever wondered what build number was in each environment? Moving to micro services makes that question even harder.
In our example above we have 3 environments. The first column is our internal monitoring server that we affectionately call Nagios, even though it runs a slightly older copy of Outlyer. Then we have Staging, and finally Production. We have simple nagios scripts that run dpkg -s
Plotting the minimum version across a group of hosts means we catch problems with servers that don’t update. Getting this level of visibility into which package version is installed where is usually a 5 minute job. We reference this dashboard multiple times a day when pressing the deploy buttons in Jenkins just to make sure everything is as we expect.
We also alert off drift between versions in each environment. If staging gets out of step with production by more than 10 builds we trigger an alert that there needs to be a release. The greater the difference between environments the greater the risk of deployment due to the size of change. We like to keep our releases small and often so that if there is a problem it’s easier to diagnose and fix.
Stop the floor on build errors

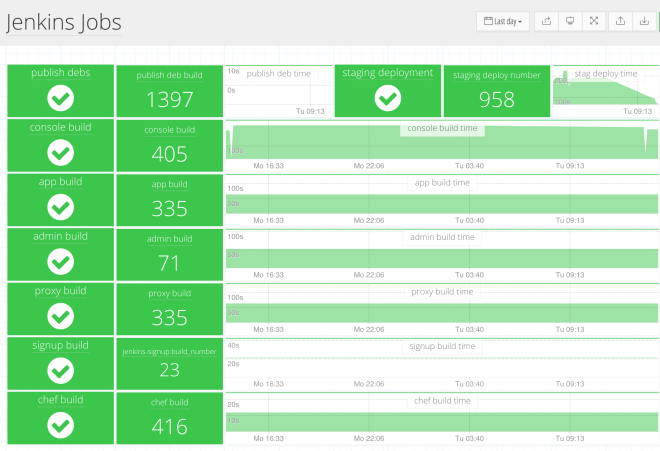
What’s the point continuing to develop software if you can’t release it? As with most modern companies we release updates to production multiple times per day. Our ability to release is paramount so we keep our build radiator dashboard green at all times. Our example dashboard above also graphs build times so you can detect if a developer has imported half of the packages on Github into the project by accident.
Continuous Testing
Different parts of an online service get built and released at different rates with different levels of risk. When dealing with an important data store you may want to do more upfront testing before it hits production. Other parts of the service may be able to move at a much faster rate, and in these cases you may want to focus more on agility with a quick build and deploy time and push more of the testing into monitoring in production. This is when you may want to create dashboards that show the current state of your smoke tests and alert on issues quickly so you can quickly roll forwards with fixes.
Summary
Many of our dashboards are being used to bring development and operations together. Whether that’s to align on features vs operability improvements, or simply to save time on errors that happen when you aren’t sure which version of software is deployed where. Overall the point of these dashboards are to improve the service as a whole; Not just from a infrastructure or code perspective as shown in our previous two blog posts, but at the level of what’s truly important; which is what customers see when they use your product.
A small efficient team working on the right things can run rings around a giant team that isn’t focussed on what’s important.
Series Posts:
Dashboard Examples: Background