Backups
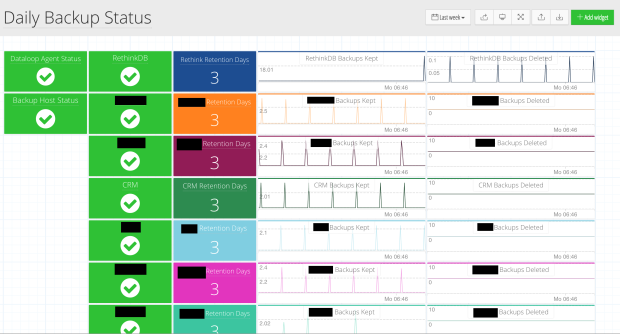
This was an unexpected example but quite a few customers have created dashboards to monitor their backups. In the old days I remember logging into the Backup Exec console to see what was going on with my backups. The random uncertainty of whether the tape library was going to respond and the joy of pressing the cleaning cartridge button.
Nowadays with the move to cloud everyone has little scripts that push stuff to Amazon S3 or similar. There isn’t that central console any more and yet people still want to glance at something that immediately lets them know all backups are happening and that the numbers look right. It just goes to show that some things, like checking the backups, are timeless.
Databases
|
|
|
|
|
|
| MySQL | ElasticSearch | Redis | Riak | Mongo |
The trend towards polyglot databases is real and happening at an alarming rate. Nowadays people have MySQL, ElasticSearch, Redis, Riak, Mongo, [insert ‘db du jour’ here]. There are obviously a lot of benefits to using the right tool for the job when it comes to managing different types of data, however, for the Ops and DBA teams this means a lot of work. Most of the dashboards created for the databases are designed to minimise the time spent troubleshooting issues, and in a lot of cases rule out the database as the problem so that effort can be focussed on getting the developers to fix the app instead.
Some of these dashboards were quite time consuming to build and then iterate on. They were created by seasoned DBA’s so we’re very happy to be able to share them via our public Github dashboards repo.
Big Data Pipelines
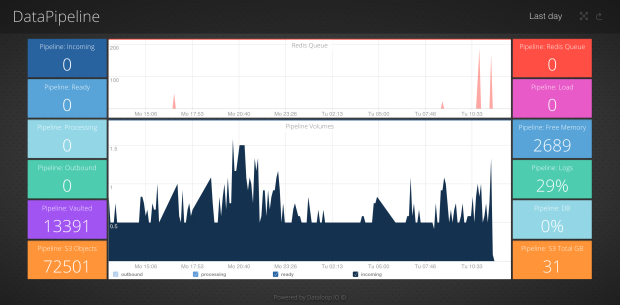
Who isn’t doing big data nowadays? Everyone I talk to is playing with Kafka, Storm, Hadoop, Spark or rolling their own with Queues, Redis, a bunch of AWS services and custom code. The sheer number of components and complexity means we have numerous dashboards in Outlyer whose sole purpose is to keep track of what’s going on. Tracking the throughput, error rates, latencies and trying to visualise capacity. Or in many cases simply checking components are running and nothing is falling through the cracks.
We blogged a while ago about the data pipelines at Outlyer and it seems we’re not alone. Log data from business processes is often a big driver for projects like this. Or in some cases going out to scrape info from the web that can then be worked on to provide value to customers.
It’s hard to put up example screenshots for these types of dashboards because there is usually a lot of context needed to explain them and they are generally very business specific. If there’s an appetite I may try to solicit some help with a couple of blog posts from customers who are willing to share their story. Here are some reasonably generic Hadoop ones in the interim:
|
|
|
|
|
|
| HBase | Hadoop | Thrift | HDFS | Swift |
Queues, Caches, Load balancers, Web Servers
Bundling all of these together as they are all related to passing data around between services. Tracking Nginx and Apache status codes is a favourite, as is alerting off of spikes of 5xx codes. What we see in general with these is that the dashboards provide context to the alerts. Usually an alert gets triggered and you want a dashboard to look at the trend and see the big picture.
|
|
|
|
| Nginx Logs | Nginx Stats | RabbitMQ |
Adhoc Dashboards
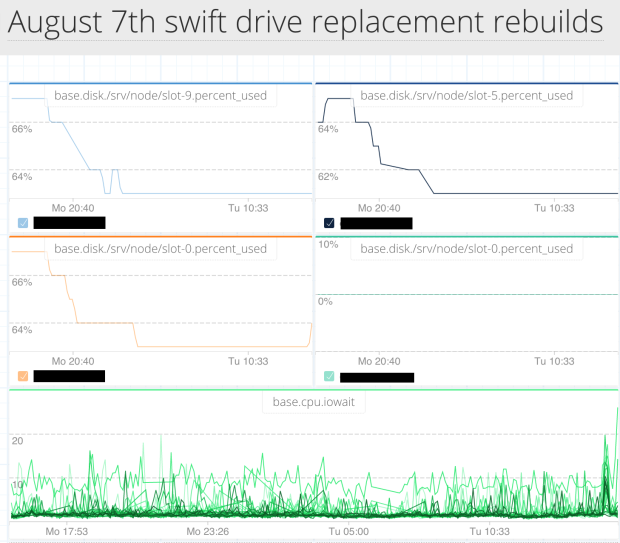
Another unexpected use like the backups example was seeing dashboards for ‘weekend hard drive migration’ and similar. I guess it make sense to create a quick dashboard showing data transfer progress for swapping some disks out. These dashboards tend to be reasonably short lived so I don’t have too many screenshots. But it just goes to show that people are quite visual and for some reason have started to think about using dashboards in a fairly disposable way as part of tasks and mini projects.
Security Dashboards
We were very happy to see DevOpsGuys pioneering dashboards that show security vulnerability patching. They went into some details on their blog about how they used Outlyer to provide visibility to their customers. We think this could be a cool area to explore, so if you’re a SecOps guy that fancies having a play with some dashboards join us on Slack and lets create some.
Summary
Operations people are mostly creating dashboards to help troubleshoot issues when something has failed - no surprises there. They are also creating dashboards for views into things they may want to check quickly, whether that’s an ongoing task like backups or short lived tasks like swapping disks. We’ve been told a number of times that it’s really nice to be able to point developers at a dashboard that proves a problem isn’t infrastructure related.
Reducing the friction of collecting metrics and making dashboards quicker to stand up has resulted in far more screens to look at. I can only assume that with so many dashboards they are being used a bit like looking up information in books. Alerts rules sit in the background as the primary mechanism for keeping track of everything.
In the future we plan to help speed up the monitoring of the generic services by adding auto-discovery features. We’ll build this on top of the shared library of plugins and dashboards (and soon rules) that we encourage all of our users to collaborate on. There are simply too many services now for someone to be an expert on everything so hopefully getting some of that knowledge into the packs will help. This should free up a bunch more time to concentrate on the more creative custom monitoring.
Series Posts:
Dashboard Examples: Background


