Battling mess is an ongoing struggle that has plagued most of my career. Docker presents an opportunity to explosively increase the chance of mess. You can of course reduce mess with a local registry, proper build process and sane use of docker files. Unfortunately, if my experiences pre-docker-era are anything to go by, things will not be done properly.
As a career SysAdmin I have mixed feelings about Docker. Why, I hear you ask? Because everything has a tendency to get into a mess. Usually when starting a new job I’ll spend time orienting myself, asking the basic questions like what servers do we have? what do they do? can we log into them all? what are the differences between environments? can I still manually create this stuff in the case of an emergency, or did we create an overly complicated monster that will one day leave us crying into our hands because we can no longer actually build stuff. Ultimately it ends up automated, but only by starting from a sane beginning.
So with the complaining now out of the way, let’s imagine you have your house 100% in order and have decided to use Docker properly. Awesome! You’re in the 1% - here’s how you could monitor those containers..
1. Run a container to scrape host and container metrics (CAdvisor)
Google provide a container that’s really easy to get running on your docker hosts. Spin up a CAdvisor container on every Docker host you have and it will happily sit there in the background sucking out every metric from the host and every running container. It presents a nice little web interface which updates in realtime too which can be fun to look at.
Command to start CAdvisor:
sudo docker run \  <br>
--volume=/:/rootfs:ro \<br>
--volume=/var/run:/var/run:rw \<br>
--volume=/sys:/sys:ro \<br>
--volume=/var/lib/docker/:/var/lib/docker:ro \ <br>
--publish=8080:8080 \  <br>
--detach=true \<br>
--name=cadvisor \  <br>
google/cadvisor:latest <br>
This starts the fancy local web interface on port 8080.
2. Run a container with a monitoring agent inside (dataloop-docker)
In the spirit of one container one task it makes a lot of sense to run your monitoring agent in a container too. You want to keep your Docker hosts clean and untainted from 3rd party software after all. You’ll need to link this container to your CAdvisor container. Docker links create network connections between containers and exposes the remote endpoint addresses via environment variable which is handy.
Command to start dataloop-docker and link it to the CAdvisor container:
API_KEY=<insert your key> <br>
sudo docker run \ <br>
--volume=/var/run/docker.sock:/var/run/docker.sock \ <br>
--detach=true \ <br>
--name=dataloop-docker \ <br>
--hostname=$(hostname) \ <br>
-e API_KEY=$API_KEY \ <br>
--link cadvisor:cadvisor \ <br>
dataloop/dataloop-docker <br>
The –link part is quite important here. As well as setting the correct API key, otherwise the container won’t pop up like magic inside Outlyer.
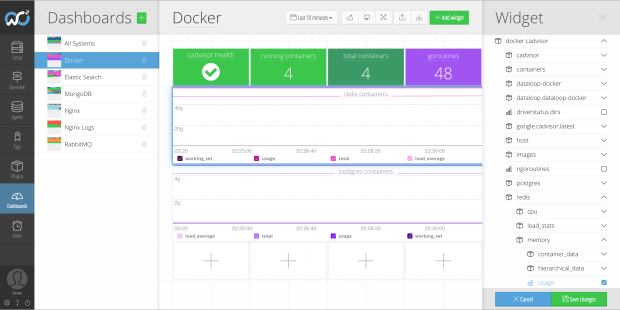
Here they are running alongside a redis and postgres container.

3. Apply a plugin to the monitoring agent that scrapes CAdvisor over the Docker link

We provide a CAdvisor plugin that automatically collects every metric from the CAdvisor API. This includes the Docker host metrics as well as every running container. We send these back centrally so they can be aggregated on dashboards and in alerts across multiple Docker hosts. It’s just a standard Nagios check script and is open source if anyone wants to play with it.
That’s pretty much it. On every Docker host you run two commands, and in Outlyer you apply a plugin to your hosts. You then get every metric possible. I counted the host, dataloop-docker and cadvisor metrics and got over 400 individual metrics. We may need to tune down the plugin one day but for now it’s quite fun to have so many.

Now the real question is how do you easily instrument service level metrics from your containers. We’ve tried a few different approaches but that’s a topic that should probably be covered by another blog post.