Since our last blog about Docker we’ve been working on making setup even simpler. Here’s a quick step by step guide in our new UI that we’ll be releasing in a couple of weeks (until then everything works the same, but things may look cosmetically different).
-
Sign up at www.outlyer.com for a 2 week trial
-
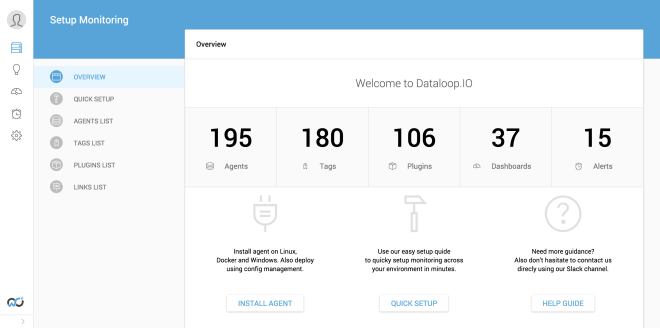
Click Install Agent at the bottom of the first page
-
Click the Docker link for the command to copy and paste onto your Docker host
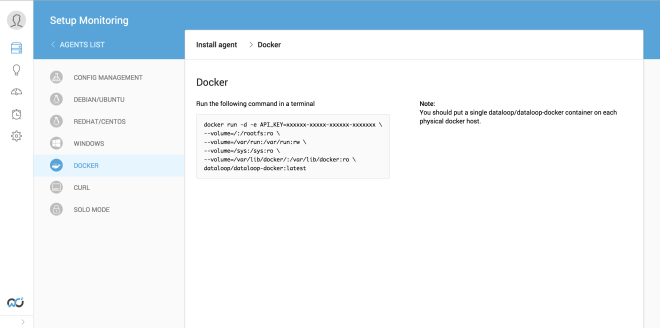
That’s it! Magic should now happen..
By default our Outlyer/Outlyer-Docker container will stay running on each of your Docker hosts and keep your containers in sync automatically. As you spin up and down new containers they will appear and disappear as if by magic. We’ve even given them little whale icons.
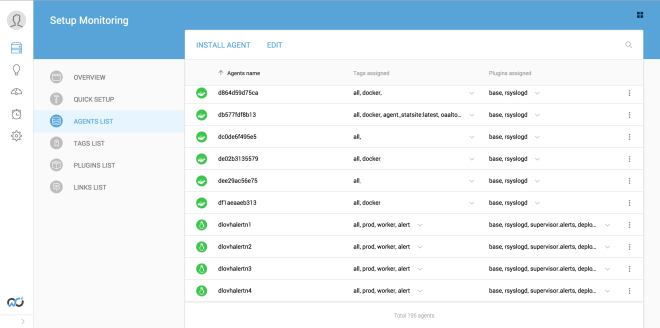
Clicking on one of the containers shows a bunch of details about when it last connected and some basic performance data.
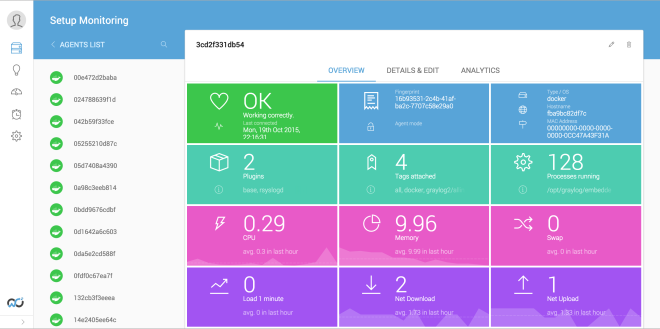
If you click the details link at the top you’ll also get a bunch of info about what’s running in your container as well as some network details. One other cool thing we do is tag your container with a bunch of stuff like their container name, image name and even some environment variables.
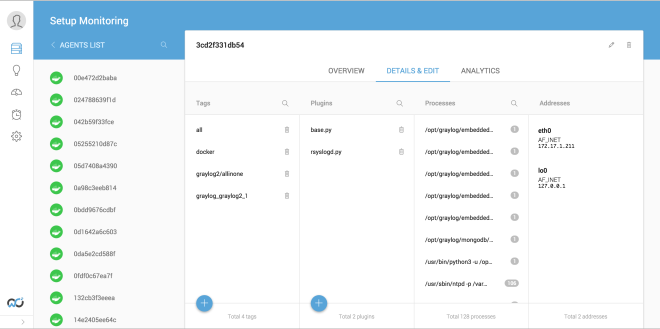
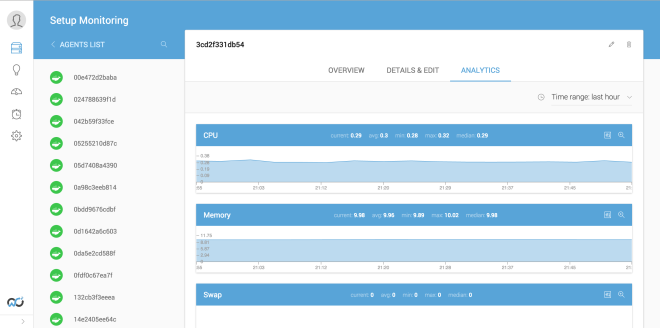
Clicking the analytics tab will give you some historic graphs showing you what this particular container has been up to. A good tip for this page is you can click on the heading numbers to overlay avg, min, max etc.
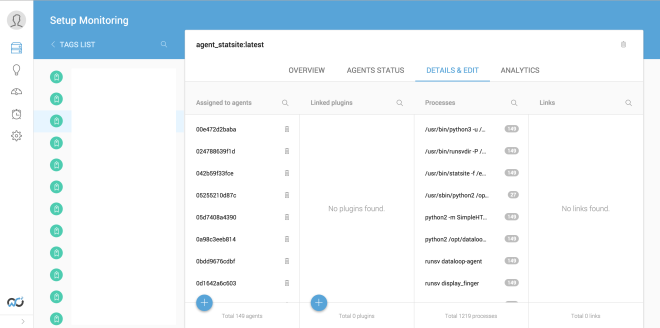
And given that we tag everything automatically you can of course browse aggregated data about your containers by looking in the tags. This one shows all the containers running our agent_statsite:latest Docker image - about 149 in total currently.
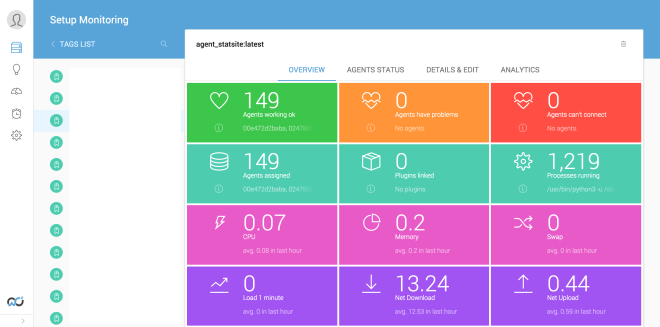
We even sum up the count of your running processes within a tag and let you view graphs across a bunch of containers with a few clicks.
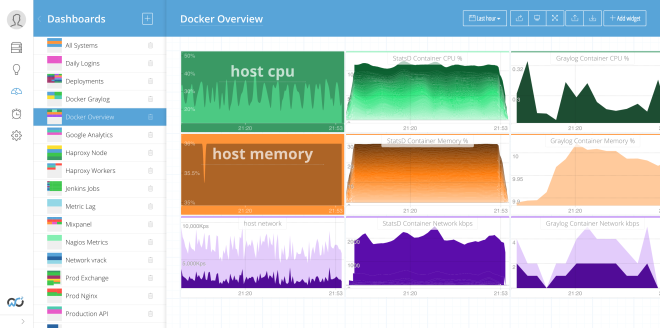
Because everything is tagged you can treat your containers like you would normal agents in Outlyer for pretty dashboards. Here we have an example showing our 149 StatSite containers and a Graylog container with some overall host metrics. A common scenario is Devs wanting to create dashboards showing resource utilisation of their containers alongside code level metrics coming from StatsD.
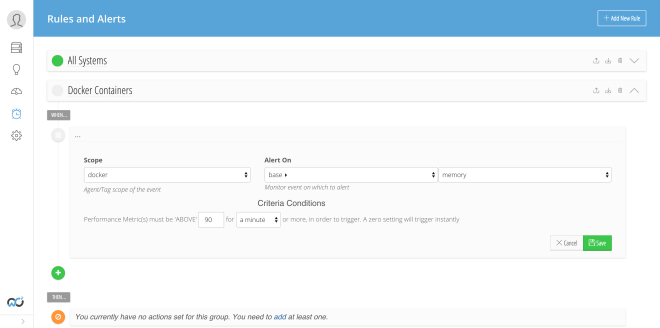
Finally you can also setup alerts on the container metrics just like anything else in Outlyer.
We hope you enjoy our next level of Docker monitoring. In theory you should be able to get up and monitored with all of your containers on a host in seconds. Combine this with our hosted StatsD and you could be doing some advanced stuff in a few hours.
We’re working behind the scenes on some cool things around monitoring popular off the shelf open source software automatically via inter-container auto-discovery. Things like MySQL and ElasticSearch. We’d love to get your feedback on the current stuff shown in this blog and any other ideas you might have for the future.
Feel free to contact us with any questions. Happy Dockering!