This is the third installment of our 4-part “Monitoring Kubernetes” series.
- Part 1 discusses the components of Kubernetes and why it is hard to monitor Kubernetes and more broadly, containerized applications.
- Part 2 (Collecting Metrics with Heapster & Prometheus) covers:
- Where to find metrics and health checks for each Kubernetes component
- Kubernetes monitoring with Heapster and the Kubenertes Web UI add-on
- Kubernetes monitoring with Prometheus and Grafana.
This post approaches how to monitor a Kubernetes cluster and a Redis cluster running on top of it as well as how to create custom dashboards and alerts to monitor a web application in Outlyer.
Outlyer Agent Installation
The agent is a lightweight container that runs on each Kubernetes node in a DaemonSet. It collects and reports metrics from all discovered containers and the underlying hosts into your Outlyer account. Once you are registered for your Outlyer account you will get your agent key, which is required in the agent configuration. This can be found under the integrations page.
You can install the Outlyer agent on Kubernetes in just 4 commands that take 60 seconds to type and deploy to get full monitoring across your entire cluster. Just follow our excellent docs here: /docs/agent/kubernetes/
In the Outlyer UI, click on Status Views and filter by the label instance.type: host. You should see all your discovered Kubernetes Nodes. Select a Node to see its details.
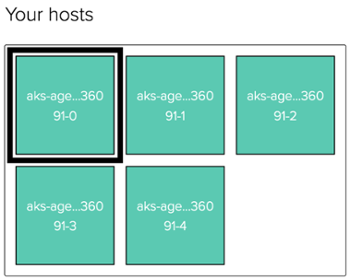
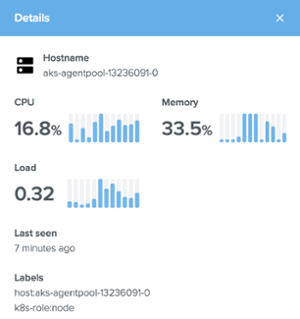
By default, the Outlyer agent will automatically discover all your pods and nodes with their associated labels and metadata as documented here.
Interested in trying Outlyer for monitoring Kubernetes? We offer a 14-Day Free Trial – No credit card needed, get set up in minutes. Read The Docs to get started in minutes.
Deploy kube-state-metrics
The kube-state-metrics is a simple add-on service that listens to the API Server and generates metrics about the state of the Kubernetes objects such as Deployments, Nodes, and Pods. In order to deploy it to your Kubernetes cluster, clone the kube-state-metrics repository and create the objects:
$ https://github.com/kubernetes/kube-state-metrics.git
$ cd kube-state-metrics
$ kubectl apply -f kubernetes/
Check out the second post of the Monitoring Kubernetes series to learn how to scrape metrics from kube-state-metrics.
Outlyer Kubernetes Integration
An Outlyer integration is a package that contains templates of dashboards, alerts, and plugins for commonly used services (check our integrations page to see all integrations available). When the Kubernetes integration is installed, you can start using our beautiful out-of-the-box Kubernetes dashboards to see the state of your cluster. They give you all the visibility you need to ensure your cluster is healthy and operating properly.
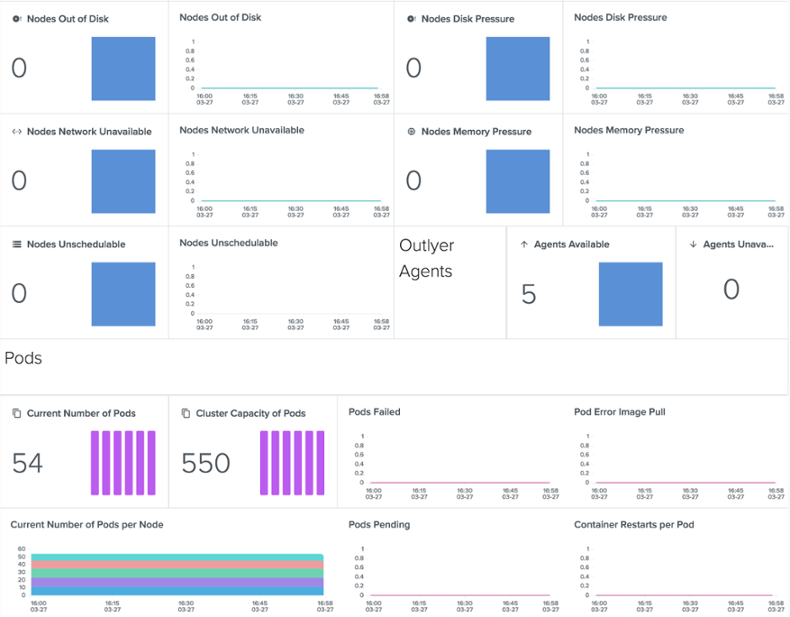 Kubernetes Cluster Overview Dashboard: Nodes & Pods section
Besides the Nodes and Pods sections, it also shows the status of components of the Control Plane and capacity planning information.
The Hosts Dashboard, shown below, provides memory, CPU, disk, and network usage information as well as and other relevant metrics for each Kubernetes Node.
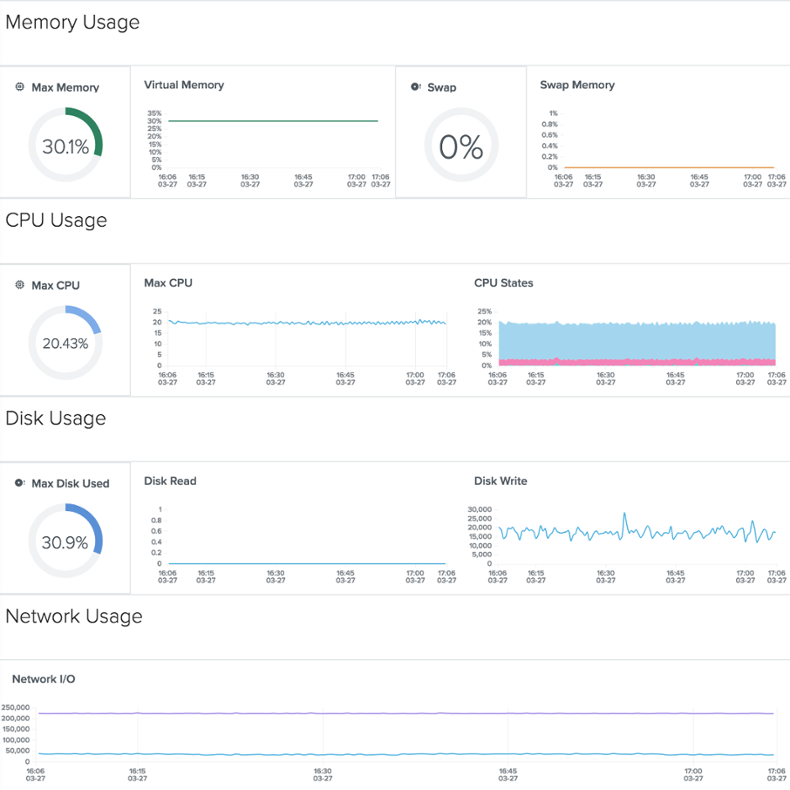 Hosts Dashboard
The Kubernetes integration provides others Kubernetes-specific dashboards that give visibility to Kubernetes resources like Pods, Requests/Limits, Deployments, StatefulSets, and much more.
With just a few clicks you can detect scenarios like “Pod A, running on Node B, is almost crossing its memory resource limits” or “Nodes A and C are overcommited”.
In part 4 of the Monitoring Kubernetes series, we will approach the most important metrics to be aware of when monitoring a Kubernetes cluster. You will be able to easily identify these situations.
Monitoring a Redis Cluster running on K8s with Outlyer
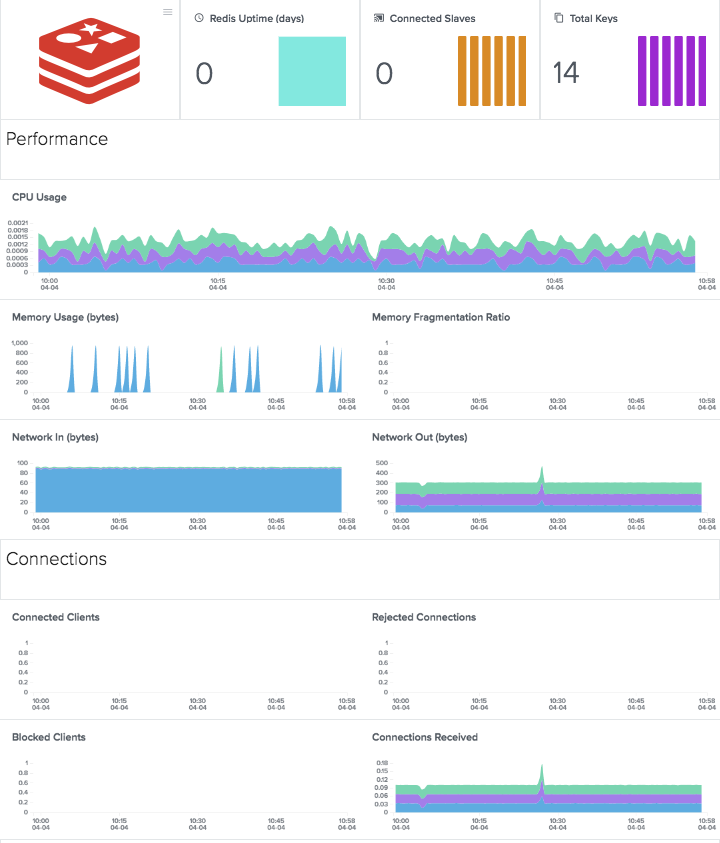
Using Outlyer to monitor a Redis cluster deployed in Kubernetes is a simple job of installing our Redis integration. Just like the Kubernetes integration, it provides a default Redis dashboard containing all the information you need to make sure your Redis cluster is working as intended.
Create Custom Dashboards in Outlyer
Outlyer integrations provide an easy way to install default monitoring dashboards, alerts, and plugins for the most common open-source services your company probably use. However, there will be times when you will need to build your own custom dashboards and alerts.
When the agents are running on your Kubernetes cluster, you can start using our simple and flexible drag-and-drop based web UI to add widgets (charts, numbers, status, etc) and create amazing dashboards with just a few clicks.
As an example, let’s create a dashboard for a web application (Kuard, from the book Kubernetes Up and Running) with a status widget that shows whether Kuard is healthy and then set up an alert to trigger an email notification whenever Kuard goes down. First, deploy a Kuard Pod to your cluster:
$ kubectl run --restart=Never --port=8080 --image=gcr.io/kuar-demo/kuard-amd64:1 kuard
Create a Check
Now that Kuard is up and running, create a new check in your Outlyer account (Checks -> Create new). Checks are used, as the name indicates, to check the status and the performance of a service.
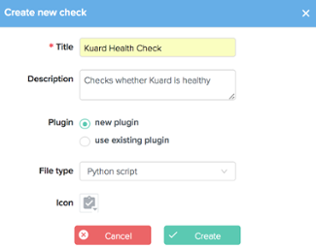
A check can be written in any language available on your server (Python, Golang, Javascript, Bash, Ruby, etc). For this example, we’ll stick to Python. The following Python script just issues an HTTP request to Kuard’s health check endpoint. The script exit code is then interpreted as a Nagios exit code.
#!/usr/bin/env python3

import requests
import sys
import os

HOST = os.environ['ip'] if 'ip' in os.environ else 'localhost'
PORT = os.environ['KUARD_PORT']
HEALTH_ENDPOINT = os.environ['KUARD_HEALTH']

try:
  metrics = requests.get(f'http://{HOST}:{PORT}/{HEALTH_ENDPOINT}').text
  print(metrics)
except:
  print(f"Error connecting to http://{HOST}:{PORT}/{HEALTH_ENDPOINT}")
  sys.exit(2)
Checks work using Selectors that allow you to target checks against any host or container label collected by or applied to the agent. Regardless of whether you’re monitoring a standard host or container, checks are configured exactly the same using selectors, making it really simple to standardise your monitoring on both container and non-container environments.
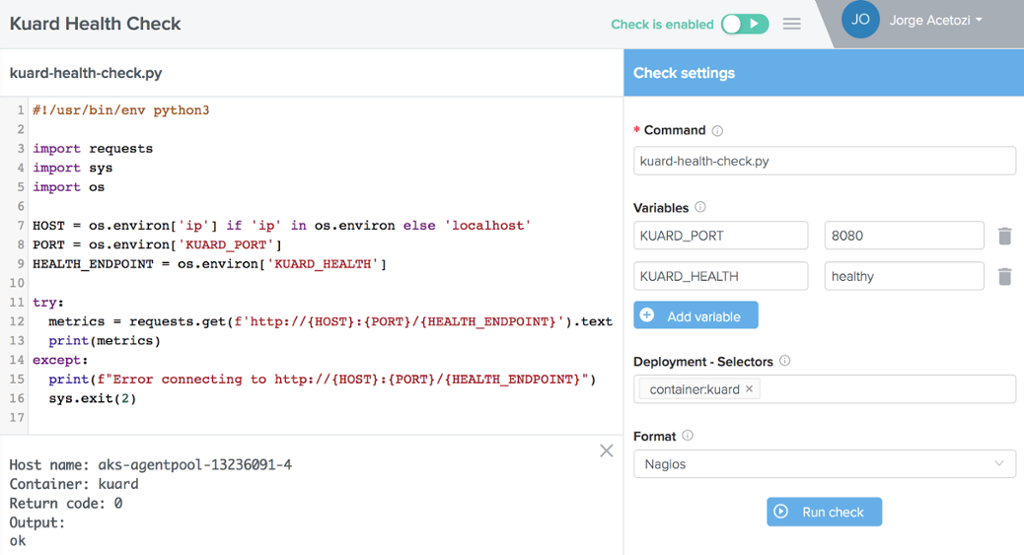
As shown below, add the environment variables KUARD_PORT (8080) and KUARD_HEALTH (healthy), pick the container: kuard selector and the Nagios format and click on Save.
Test the check by clicking on “Run check; you should see the return code 0 and output “ok”. Enable the check on the top menu (in green) so that the agent starts running it against Kuard. It should look like this:
Create a Dashboard
Create a new Dashboard (Dashboards -> Create new) named Kuard, then click on Add Widget and select the Status widget.
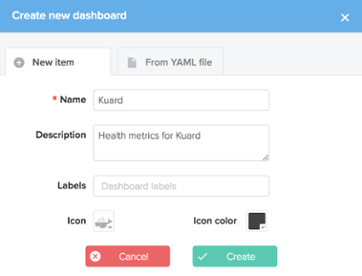
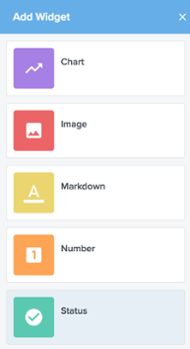
Note that dashboards (as well as alerts) can be exported to and imported from YAML files, so you can always keep a copy under version control, tracking every change.
Edit the status widget and give it the title Kuard Health. Click on the Queries tab, select the check kuard-health-check and save it. There you are! The status widget immediately becomes green, which shows that Kuard is healthy.
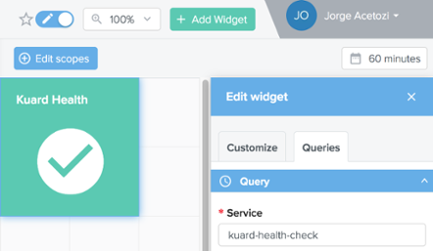
As you add more and more widgets to a dashboard, you can move them around by using the built-in drag-and-drop feature to create useful, organized and beautiful dashboards.
Create an Alert
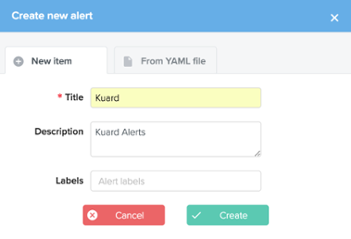
Create a new Alert (Alerts -> Create new) named Kuard, then add new criteria by selecting the Service Status Criteria:
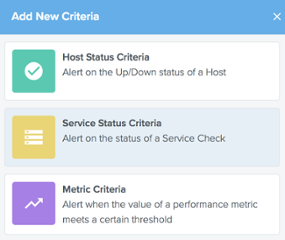
Add the kuard-health-check to the service field, give it the name Kuard Health and save it.
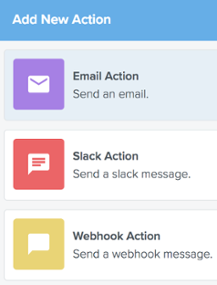
Add a new action to specify where Outlyer should send notifications when the configured alert criteria thresholds are crossed. Save it.
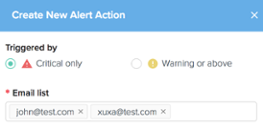
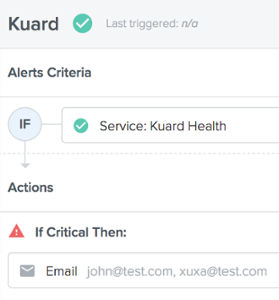
That’s it! From now on, if Kuard is down, everyone on the email list will get notified.
When it comes to alert notifications, Outlyer integrates with well-known messaging tools like Slack, HipChat, and webhooks, making it ideal for implementing ChatOps practices.
Conclusion
In this article you have learned how to use Outlyer to monitor Kubernetes and a Redis cluster running on top of it. You have learned how to create custom dashboards and alerts in just a few clicks.
In the next post, Part 4, you will learn which are the key metrics you should be aware of when monitoring a Kubernetes cluster.
Kubernetes Blog Series
- Part 1 Getting Started with Kubernetes Monitoring
- Part 2 Collecting Kubernetes Metrics with Heapster & Prometheus
- Part 3 How to Monitor Kubernetes with Outlyer
- Part 4 Key Kubernetes Metrics to Monitor
Interested in trying Outlyer for monitoring Kubernetes? We offer a 14-Day Free Trial – No credit card needed, get set up in minutes. Read The Docs to get started in minutes.