CloudWatch, the default monitoring tool on AWS, is an essential tool to use when hosting apps on AWS.
However, CloudWatch is just that—a default monitoring tool. It’s not designed to be the best or most comprehensive monitoring tool for all use cases on AWS.
While you can and should use CloudWatch to help monitor apps and services hosted on AWS, in order to get the very most out of CloudWatch, you should learn to leverage its advanced features and use it in combination with other monitoring tools.
In this post, we’ll take a look at how you can extend CloudWatch by combining it with other AWS services, open source tools, and end-to-end monitoring platforms.
What’s in the CloudWatch box
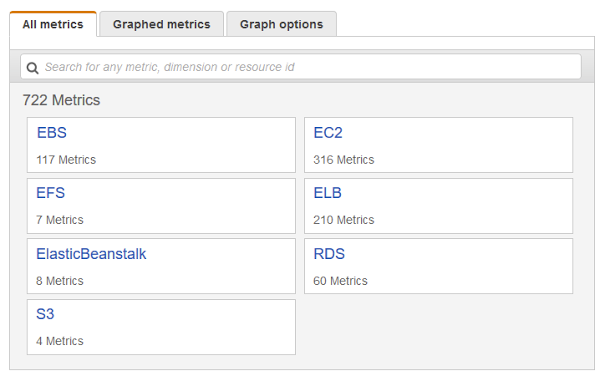
As you start with CloudWatch, you’ll get the basics, that are just enough to get you started. There are three types of data that CloudWatch reports—metrics, logs, and events. Metrics are the performance numbers that you most frequently want to see. This includes numbers about CPU, disk, and network utilization.
 Source: Amazon.com
There are hundreds of different metrics available for EC2 instances, and a good number for other AWS services as well.
Logs go deeper than metrics, providing details like error messages. And events record the change history of your AWS resources. These both augment metrics and give you deeper visibility. Once your app gains traction, you’ll find that you need more robust monitoring. In this case, you should consider paying for some monitoring perks within CloudWatch.
Upgrade for frequent updates
The free tier of CloudWatch has restrictions on the number of dashboards you can create (3), the number of detailed metrics you can track (10), and the frequency of updates (5 mins). This is enough to get started, and can work well for some apps that aren’t mission-critical. However, if you’re serious about your AWS monitoring, you’ll want to upgrade to the paid tier of CloudWatch.
The paid tier gives you more dashboards, detailed monitoring, custom metrics, alarms, logs, and more. The best part is that you don’t need to pay a flat fee for features you don’t use. You pay by the number of alarms triggered, or custom metrics tracked, for example. This makes the jump to the paid tier very accessible. Recently, there’s been a price drop for CloudWatch, making it even more attractive. View the CloudWatch pricing page for more details.
Once you’ve explored everything within the boundaries of CloudWatch, you’ll soon set sights beyond, to other AWS services.
Making the most of AWS services and features
Apart from upgrading to the paid tier of CloudWatch, you can get more out of CloudWatch by combining it with other tools from the AWS stable. Here are a few ways.
- CloudTrail: This is a service that logs API calls to any AWS service and lets you track where it comes from, and when it happened. You can send CloudTrail logs to CloudWatch to gain more visibility into changes.
- S3 storage: You may want to archive your CloudWatch Logs data for ad hoc analysis, or for compliance purposes. In this case you can store them in S3. There are separate charges for data ingestion and data storage which you’ll need to keep an eye on.
- Custom metrics: CloudWatch lets you bring in data from your non-AWS infrastructure. This has two advantages—You get to see metrics for all your infrastructure in one place, and you can leverage the analytics features of CloudWatch. While this is possible, you’ll probably want to use a more robust tool than CloudWatch as your end-to-end monitoring tool. More on this later in the post.
Event-driven automation with AWS Lambda
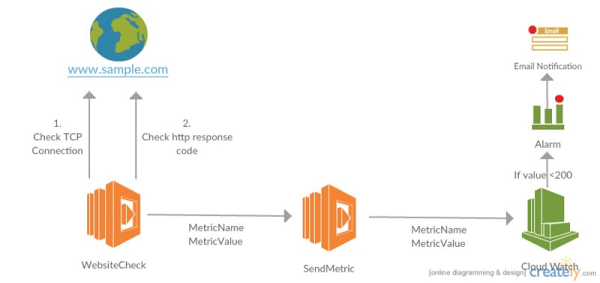
While I could have included this in the previous section, AWS Lambda deserves a section of its own because of how powerful it is for extending CloudWatch. Lambda is a serverless computing platform that runs code as a set of functions, and doesn’t require you to maintain any infrastructure to run your code. It is a powerful tool when combined with CloudWatch. For example, you can monitor the state of a web server and get an alert whenever there is an outage.
 Source: Medium.com/@mrdoro
In this use case, Lambda would poll the server every few minutes, and if it’s unable to connect to the server or receives an error message, it sends a notification to CloudWatch, which in turn notifies you by email. You can configure Lambda to execute further rules for automatic backup. For example, you can set up a backup EC2 instance, and every time there’s an outage, start up that instance, and redirect traffic to it.
Another way to use Lambda along with CloudWatch is to send alarms to third-party tools like Slack.
 Source: Amazon.com
You’ll need to set up a new SNS topic to which you’ll post CloudWatch alarms. From here, you customize a Lambda function to read messages from the SNS topic, and send them to a Slack channel via a webhook integration. AWS has even provided Lambda blueprints to make it easy to set up this integration between CloudWatch and Slack.
Lambda lets you respond to changes in resources in real time. It can be used to automate infrastructure management, create snapshots of particular data, and integrate two services. This kind of event-driven automation is key to facilitating DevOps.
Open source integrations
There is a growing list of powerful open source monitoring tools that can benefit any DevOps team. CloudWatch can be extended beyond AWS using these tools. Let’s look at some of the most popular open source tools that can be used to extend CloudWatch.
Collectd is a data collection and transfer tool that receives performance data of an application, operating system, and other layers of the stack, and makes it available to other monitoring services. Recently, AWS announced a plugin to share metrics from your non-AWS infrastructure with CloudWatch using collectd. This is useful if you want to archive your non-AWS applications’ performance data in S3 buckets, or if you want to set rules for alerts and manage them from within AWS.
Collectd can be a great starting point for an end-to-end monitoring system, as it has a wide list of plugins and lets you build your own plugins easily. It scales to thousands of nodes, and does a really good job of collecting and sharing metrics to service—its core functionality.
Boto3 is the official AWS SDK for Python. It connects with CloudWatch, and a host of other AWS services, and makes their data available as Python classes. It’s an open source tool and is currently adding support for the latest versions of Python, although previous versions are fully supported. Boto3 pulls metrics, alarms, and their dimensions from CloudWatch and lets you take action right from within Boto3. You can use Boto3 to automate AWS resources like EC2 instances, S3 storage, and RDS databases, but integrating Boto3 with your CloudWatch metrics is a great starting point.
While collectd manages data transfer across your systems, you may want to leverage a more robust visualization tool to augment CloudWatch’s capabilities. Grafana is just the tool for this job. Grafana has built-in integration with CloudWatch, and lets you pull data from CloudWatch and create beautiful dashboards for analysis. It even pulls custom metrics, and lets you run powerful queries on the imported data. Its wide variety of charts and visualization options lets you quickly analyze data and take action.
If you’re familiar with the ELK stack (Elasticsearch, Logstash, Kibana), AWS provides a template that you can use to set up monitoring dashboards in Kibana in 10 minutes. You can also run queries on the data with Elasticsearch. Setting up and maintaining this stack on your own may be a pain, and you’ll want to consider hosted options.
Tools like collectd, Boto3, and Grafana are becoming a staple of every monitoring process. Integrating them with CloudWatch can bring a lot of efficiency to your monitoring strategy.
Turning alerts into Incident management
Previously, every member on the team would be subscribed to an email list from which they were informed of outages. This, however, is very inefficient when dealing with modern distributed apps. It leads to alert fatigue as the number of emails becomes overwhelming, and people may miss seeing the emails. These drawbacks mean that resolution takes even longer. A better solution is to use a dedicated incident management tool like Pagerduty or VictorOps.
An incident management tool has a mature rules-based system to route alerts to the right person at the right time. Integrating CloudWatch with an incident management tool will greatly help bring down MTTR (mean time to resolution). These incident management tools have simple integrations with CloudWatch, and are a great way to make CloudWatch data more actionable.
Use an end-to-end monitoring tool
You may try some or all of the above ideas and get frustrated with tool sprawl, or suffer from “analysis paralysis.” In this case, I recommend you use a single monitoring tool for end-to-end monitoring. This brings sanity, agility, and much-needed action to your monitoring process.
For end-to-end monitoring of your AWS and non-AWS resources, you can consider a capable monitoring tool like Outlyer, which has a simple integration with AWS. Once installed, it automatically discovers all AWS services that need to be monitored, and brings many advantages over CloudWatch. For example, it lets you create unlimited dashboards from your data, eliminates the need for S3 buckets (as it stores data forever), and provides unlimited alerts, too. A third-party monitoring tool will give you the best of both worlds—AWS metrics coming straight from CloudWatch, and metrics for the rest of your infrastructure, all in one place.
As cloud environments become more numerous and hybrid in nature, monitoring tools need to adapt to become more extensive, better integrated, and more powerful in terms of the analytics features they offer. CloudWatch is a great monitoring tool when you’re just getting started with AWS, but as your monitoring needs become more demanding, you need to leverage external tools that can work with CloudWatch, leverage its strengths, and add new capabilities apart from CloudWatch.
Fortunately, the options to supercharge CloudWatch are numerous. You can leverage AWS’ services and features like CloudTrail and Lambda, or you can go with open source tools that specialize in particular tasks like querying and visualizing data. Or you can opt for exclusive monitoring tools that give you end-to-end monitoring in one place. The route you take will depend on what you expect from a monitoring solution, how much time you have to implement the solution, and how difficult it is to maintain. But no matter which end of the spectrum you fall in, there’s always a way to supercharge AWS CloudWatch, and take your monitoring to the next level.