Monitoring at scale is a hard task so we often get asked by people what our architecture looks like. The reality is that it’s constantly changing over time. This blog aims to capture our current design based upon what we’ve learnt to date. It may all be different given another year. To provide some background we initially started Outlyer just under 18 months ago. Before then we had all been involved in creating SaaS products at various companies where monitoring and deployments were always a large part of our job.
We had a fair idea about what we wanted to create from a product perspective and what would be needed in order to make it scale. Our aim was to build a platform from the ground up that would sit between New Relic (Application Performance Management) and Splunk (Log Management) to provide the same set of functionality provided by Nagios, Graphite, Dashing and complex configuration management tooling.
Customers would still need to write Nagios check scripts, configure 3rd party collectors to output Graphite metrics, and setup their own dashboards and rules. However, we would provide a highly available, massively scalable SaaS hosted solution that took away the hassle of running the server side piece entirely. Everything we do on the collection side is totally open source and standards based which means no lock in. Like many, we had got frustrated by the lack of customisation possible in most of the MaaS tools available at the time.
We would provide a fancy UI that simplifies and speeds up setup and helps gain adoption outside of operations team in micro-services environments. We would also help anyone to create dashing.js style dashboards to change human behaviour without any programming knowledge. Our current product direction is:
A customer signs up to Outlyer, downloads and installs an agent on their servers and magic happens.
Architecture Overview

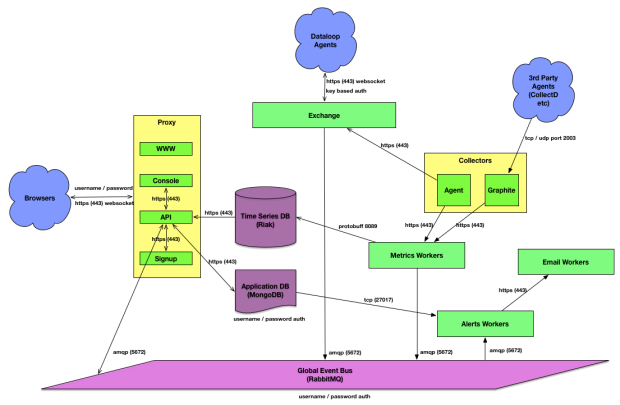
We knew from the beginning that we would likely end up with thousands, if not hundreds of thousands (or potentially millions) of agents. In our case an agent is a packaged piece of software that we provide to customers that performs the same job as the Nagios NRPE agent, or the Sensu agent. There is one subtle difference to our design in that we don’t do central polling in the traditional sense. Each agent has its own scheduler and is responsible for keeping a websocket connection alive to the agent exchange as shown in the picture. This means we de-couple up / down and presence detection from metrics collection. The agent is passed down a set of configuration which includes which plugins to run. It then inserts those plugin jobs into its own scheduler and sends back the data. In the event of network failure the agent will buffer up to 50mb of metrics which can be replayed when connectivity is restored. We use Chef.IO’s awesome omnibus packaging system to bundle up our Python agent along with an embedded interpreter and all of the dependencies required by our out of the box Nagios check scripts.
On the server side everything in green coloured boxes in the diagram above, are NodeJS micro-services. The backend is essentially a routing platform for metrics and Node is especially well suited for IO bound operations. From a deployment perspective we have kept it extremely simple. Each micro-service is packaged up into a .deb and split into app nodes (that run the services that customers connect to) and worker nodes that run the workers. These currently run on large physical dedicated servers (4 app nodes and 6 worker nodes). We can add more hardware within a few minutes to each of these areas depending on what our current load looks like. Ultimately, we may end up moving towards docker on mesos with marathon. For now we’re pretty happy with pressing a button in Jenkins which triggers ansible to orchestrate the setup and chef to configure.
Everything communicates via a global event bus which is currently in RabbitMQ. We have a single 2 node cluster for redundancy which is currently passing approximately 60,000 messages per second between various exchanges. Metrics per second varies as we stuff multiple metrics into a message (up to 10 metrics per message currently). As we add more load we will shard across multiple pairs of Rabbit boxes. Our basic load testing has shown we can scale to several million metrics per second on the current hardware. When we get close to those numbers we’ll add more hardware, load test, and tweak the design.
Although it isn’t shown on the drawing we use hardware load balancers for external https traffic and Amazon Route53 with health checks for the graphite tcp and udp traffic. Internally we use HAProxy and Nginx.
We think about the various components in the following terms:
Sources: Agent, Graphite. We may support additional sources later depending on what becomes popular. For our agent we chose Python mostly because that’s what we write our Nagios check scripts in.
Collectors: Exchange, Graphite - these are the end points we host that the sources send to. Things we have thought about here are collectors for OpenTSDB, SNMP, Metrics V2.0, although none of those have significant traction to warrant addition. Our architecture allows us to add any arbitrary interface while keeping the core code stable.
Queues: RabbitMQ does everything. We’ve looked at Kafka but the complexity of running another technology doesn’t seem worth it.
Workers: All NodeJS but we could write these in any language. We already have 10 micro-service packages and I expect that to increase as time goes on.
Databases: Riak and Mongo. Why Mongo? Well, the library support and dev time with NodeJS apps is really quick. If you use it in the right way it’s actually very good. We keep Mongo away from the metrics processing pipeline as it becomes very hard to scale once you move beyond simple scenarios. What it is good at is document storage for web applications.
Why Riak? It’s awesome. We were a bit early for InfluxDB when we discussed using it with Paul Dix last year. Our servers are dedicated physical boxes with striped SSD raid and it’s not unfeasible we’ll lose a box at some point. We sacrificed a lot of development time building a time series layer on top of Riak in return for a truly awesome level of redundancy.
People always pop up and ask us ‘why not X’ database. Some we have tried and were too slow, others had issues in the event of node failure and some we haven’t looked at. At this point we’re pretty happy with Riak and until we’re a bigger company we can’t dedicate a lot of time to moving technologies. Although, we are guilty of playing with new stuff in our spare time (currently looking at Druid).
Console: Single page app written in Backbone with Marionette. We wanted a single public API that we could give to customers and a single page app sitting on top that would give our real-time metrics processing an instant wow factor. Like every company that’s full of Javascript developers we’ve started to add a bunch of reactive stuff into the console.
Metrics Pipeline
When we talk about metrics what we mean currently is converting Nagios format metrics and Graphite format metrics into our own internal format for processing.
A Nagios Metric might be:
"OK \| cpu=15%;;;; memory=20%;;;;"
Nagios scripts also return an exit code of 0, 1, 2 or 3 depending on success warning or failure. We process these in line with the performance data metrics.
A Graphite metric might be: “load.load.shortterm 4”

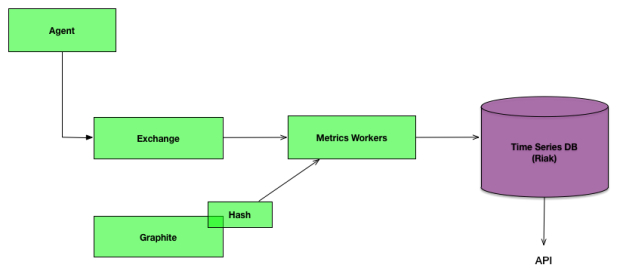
Each agent binds to a particular exchange which means chunks of data from the same source can be sent to the metrics workers for processing. The Graphite data is a little harder to process since the data could come from any host. To solve this we use a consistent hashing algorithm to direct messages to the correct metrics worker for processing. Data is then inserted into Riak sharded by time and series.
In order to increase throughput we have implemented various bucket types in Riak. Metrics initially get written to an in-memory bucket which are then rolled up for persistence. Colin was invited to give a talk about event processing in Riak at last years Ricon.
Alerts Pipeline

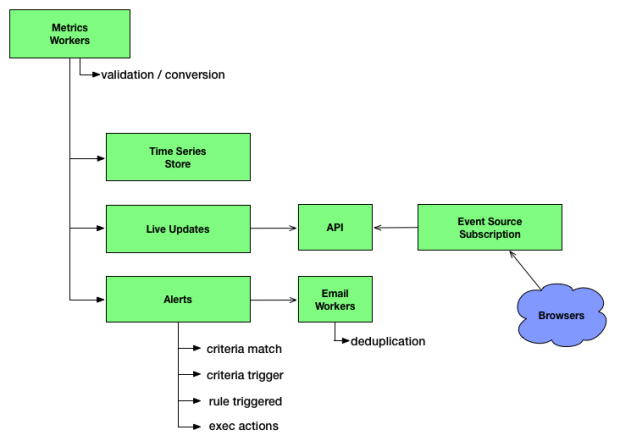
The metrics workers split the pipeline into 3 parallel tasks. Time series storage happens as you would expect, with the data being written to Riak.
Live updates are sent directly to the browser to provide real time metrics. With the Graphite endpoint it is not unusual for customers to stream 1 second updates to us. We want to ensure that those updates appear instantly.
The alerts engine itself is a state machine that works on each metric to decide what action to take. In the future we intend to add additional exec actions so that customers can write scripts that we execute to automatically fix problems, or automate their run-books via our ‘if this, then that’ style rules.
Challenges
From day one we’ve been working for paying customers who have helped drive our roadmap. Initially we started with a simple agent and Nagios check scripts that run every 30 seconds. Scaling that up isn’t terribly challenging as the volume of metrics is within the boundaries of what you can process on a single node with some failover. As you scale up you can just shard. It was obvious that we needed a ‘push gateway’ so that metrics could be streamed in at high resolution alongside the Nagios data. What wasn’t obvious was how quickly in the product roadmap this would be required. We chose Graphite for this as it’s incredibly popular and expands our out of the box collection significantly, however it also creates a big data problem and means you end up needing to become a distributed systems expert. We’ve hired some clever people but the technical challenges of processing at this volume means that everyone is on a steep learning curve all of the time.
Writing our own time series data store was also not something we wanted to do. If we had started later I believe we would have gone with InfluxDB and saved a bunch of time. Eventually they will add features we desire and we’ll be sat watching from the sidelines knowing we’ll need to write those ourselves. Not much we can do about that now, other than make the product so awesome that enough people buy it we can afford the migration time later.
We have in the past accidentally pushed some data required by the processing pipelines into Mongo. This was done for convenience and speed, but it came back to bite us. If we had spent the time to plan this out properly and designed for it in Mongo it would have been fine, but unfortunately we didn’t, so we’ve had a bit of a hard time extracting all of that in flight into Riak.
NodeJS has worked out pretty well in general. The entire team have a high proficiency in Javascript and code is shared via npm packages across every component, including the front end. We have hit some problems with concurrency and memory leaks, but over time we’re getting better and those are being resolved quickly. We’ve also been hit with a few type related bugs in the past where metrics strings have been added to floats causing outrageously wrong data. Wherever types are important we now add a lot of unit tests and code using safer parsing options.
The agent itself has also been a massive challenge. After the first few iterations we’re on version 3 which is an omnibus installer with an embedded python interpreter. We had numerous issues with PyInstaller and various threading issues. Writing code that runs on somebody else’s machine is hard . You never know what crazy stuff might happen. Unfortunately, some companies spend a while rolling out our agent manually so it’s hard to ask them to update to newer versions with bug fixes in it. We’ve had to put a lot of time into testing and building stability and reconnect logic into the agent. Sometimes it feels like we’re working for NASA designing software to run on the Mars Rover when we code for the agent, as once it’s released you may never get the chance to fix it.
Wins
Overall going with a micro-services style architecture has been a huge help. We are able to split services across boxes and isolate issues very quickly. Being stateless means we can just spin up more. Hooking everything together over a global queue has also simplified things immensely, as we don’t need service discovery or any of the other complex tooling you’d expect to find when using REST.
Although we believe picking a different time series database might be a better option in the future we also gained a lot for free from Riak. We have lost nodes in the past and it hasn’t been a big deal. Adding more capacity is also a breeze, as is monitoring it. From an operations perspective Riak is amazing.
Summary
Usually these types of post start with statistics about X customers with Y agents and Z metrics per second. From a technology perspective those are all fairly irrelevant. Youtube probably processes more bits per hour that we will all year. What does matter is what you are doing with the data and why. Hopefully this blog has helped explain a little about our architecture, what we’re doing behind the scenes, and why.