When we started Outlyer about 8 months ago it was clear that there was room for innovation in the monitoring space. The de-facto tools in use by most companies were written over a decade ago and hadn’t changed significantly since their conception. There was a big push to improve the state of affairs on Twitter under the hash tag #monitoringlove and we’ve seen some great projects come out of that; Sensu, Graphite, Riemann, Dashing to name only a few.
While designing our alerts system we’ve obviously been influenced by the grand daddy of monitoring systems.. Nagios. After spending 10 years setting up new Nagios installations it becomes hard to think about stuff any other way. When Sensu came along it caused us to think slightly differently and Riemann added a totally new spin on things with the stream processing. Even though improvements were being made I couldn’t help but think there must be a better way.
Then one day I downloaded an app called ‘If This Then That’ (IFTTT) and the penny dropped. With this app they had created one of the easiest interfaces I had ever seen for alerting. Our goal is all about getting adoption outside of the traditional silo’d ops team. We already had simple monitoring configuration and dashboard creation working, and what we now needed was a simple way for teams outside ops to setup their own alerts. You can have the most technically impressive monitoring solution ever created, but if only 1 person can use it then I think that’s a shame. You’d get more business value from a system that is open and lets others fiddle with it.
I won’t say it was easy. It took us in total around 4 months of development time to produce the first version (half or our entire company life span). However, what we have ended up with, I believe, contains the best of the ideas from Nagios, Sensu and Riemann. We process Nagios performance data alongside Graphite data in real-time using a stream processing engine like Riemann. We can do this based on individual servers or tags of servers (similar to how Sensu allows you to group machines together). And on top of all of this we’ve put an interface very similar to IFTTT so that anyone can create rules.
Here are some early screenshots that show the new rules in action:
- Initial creation of a rule
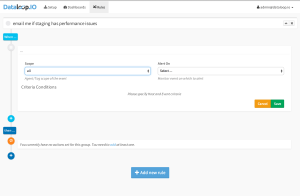
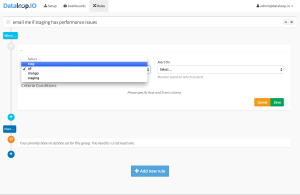
- Select the scope (individual box or tags of boxes)
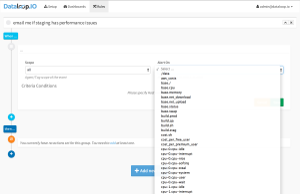
- Select a metric (notice that the Nagios metrics and Graphite / StatsD metrics now share the same namespace)
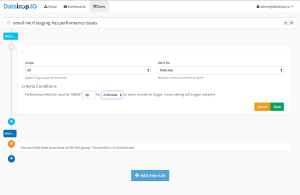
- Set a condition
- Set an action (in this case tell it who to email)
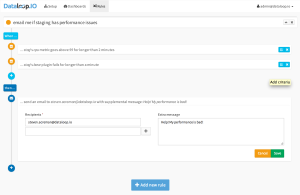
And the final rule with everything automatically checked and the lightbulbs all green!
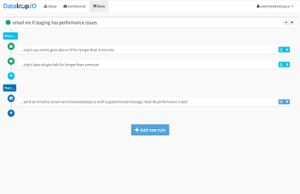
I may not have mentioned it already but you can set multiple criteria and actions. If you set multiple criteria then they all need to match to trigger the action. This can be used to drastically reduce the chance of getting woken up by accident.
So what’s next? Well, we have a bunch of work to do based on feedback around grouping these rules into sections so they can be collapsed. We’re also going to add the ability to run scripts when criteria are met. Obvious examples are scripts that automatically spin up more VM’s if a service starts to break. As well as scripts that log tickets or even order pizza at completion of a live deployment!
There are approximately 20 large companies on Outlyer now and we’re expanding that daily to get more feedback from companies running cloud services before we launch online towards the end of this year. If you are running an online service then get in touch and I’ll get you onto the free beta.