Tell me if this sounds familiar. Your users are complaining about the performance of a Java application in production, so you take a quick look at CPU and memory usage on the host. Both are fine. You dig a little deeper with tools like ps, nmon, sar, and iostat. Still nothing terribly wrong. With a sinking feeling, you realize the problem lies somewhere inside the JVM. What do you do now?
Basically, you have two options.
Option one is to get out the big hammer and install an application performance management (APM) tool. APM tools can instrument your application down to individual lines of code. They can find slow code, memory leaks, slow SQL queries, and other performance gremlins. But APM tools are often expensive, and require you to install an agent into the JVM and restart it — thus destroying any evidence of the problem until it happens again. And that’s before we consider the RAM, storage, and bandwidth requirements these products often have.
Option two is to use free tools that you may already have, like JConsole or VisualVM. Either of these can connect to a running JVM and examine performance metrics exposed by Java Management Extension (JMX) objects called MBeans.
Here’s a chart comparing the various options:
| Advantages | Disadvantages | |
|---|---|---|
| APM Tools |
|
|
| JMX Tools |
|
|
There is also a middle way, using a low-cost tool like Outlyer to do most of the JMX heavy lifting for you, but more on that later.
If your back is up against the wall, I’d suggest trying JMX first. If JMX tools don’t give you enough detail to figure out the root cause, then you can investigate more heavyweight APM tools.
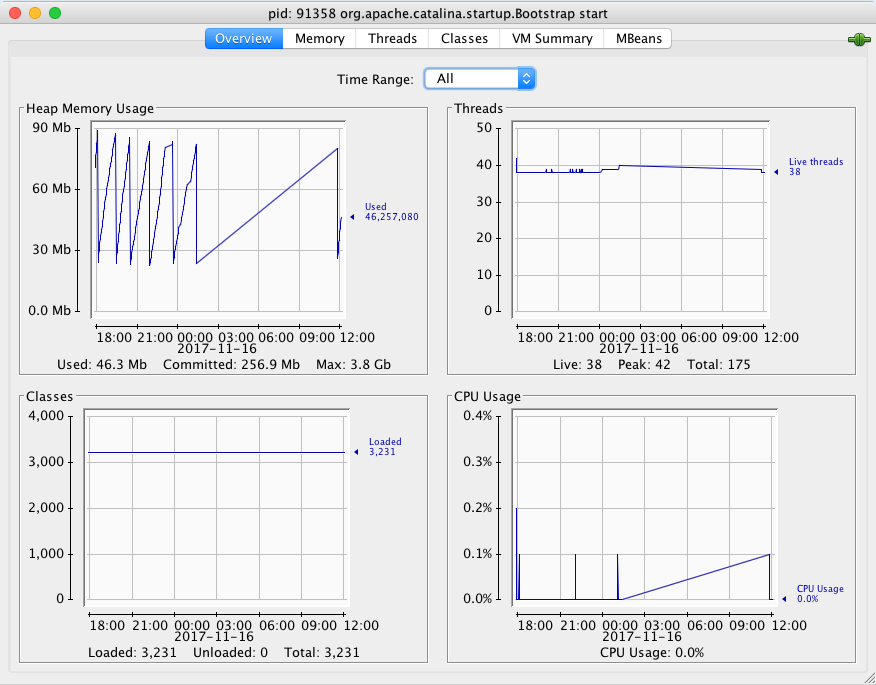
So once you’ve followed one of the many tutorials on how to launch JConsole or VisualVM and connect it to a running JVM – including one we posted a while back – what should you look for?
I’m glad you asked.
Key Java Performance Metrics
In this section I’ll explain some of the most critical metrics related to Java performance. I’ll explain where you can find them with an MBean browser (like JConsole), why they’re important, and what danger signs to look for.
Heap Memory
Heap memory is the space where Java stores objects. Everything from strings to the most complex data structures is stored here. The JVM has a set of very efficient routines to allocate, free, and manage this memory, but guess what? It’s not perfect and memory is not unlimited.
You can’t tell what Java is doing in the heap with your usual command-line tools like ps. That’s because Java asks the OS for heap memory on startup, and manages within that space itself. You need to use tools that look inside the JVM.
Once you do, you’ll find a wealth of metrics. Here are some of the most important:
| Bean Name | Attribute Name | Description Name |
|---|---|---|
|
java.lang:type=Memory |
HeapMemoryUsage. max |
The maximum amount of memory your JVM can request from the OS, in bytes |
|
HeapMemoryUsage. committed |
Memory the JVM has actually requested from the OS so far, bytes |
|
|
HeapMemoryUsage. used |
Bytes of memory actually in use |
If HeapMemoryUsage.used approaches HeapMemoryUsage.max, the JVM is no longer able to allocate memory. The log file will fill up with java.lang.OutOfMemoryError messages and the JVM will likely crash.
But your problems will actually start long before this. Once the heap usage (the percentage of “used” divided by “max”) exceeds 90%, the JVM will start to frantically throw out old objects and compact the remaining memory. This process is called garbage collection and it can have a terrible effect on performance. More on this below.
If your application is running out of heap, and you have more RAM available on the host, try giving more memory to the JVM. Here’s a calculator that shows you what command line options to add to your startup script.
Non-Heap Memory
Besides data objects, the JVM needs to store the loaded bytecode itself, as well as internal data structures. These are stored in an area called non-heap memory, and like the heap area, the size of the non-heap area is fixed at startup. If you have a large application with many classes or methods, it’s possible you will need to increase the size of this area. Here are some metrics to watch:
| Bean Name | Attribute Name | Description Name |
|---|---|---|
|
java.lang:type=Memory |
NonHeapMemoryUsage. max |
Maximum size of the non-heap area |
|
NonHeapMemoryUsage. used |
Non-heap bytes in use |
If you need to resize the non-heap area, the JVM memory calculator I linked earlier is a good reference.
Garbage Collection
As your JVM runs, there are background processes to sweep up old objects and compact the remaining free space in a process known as garbage collection. Heap memory gets fragmented over time, and garbage collection is like defragmenting a hard drive: it moves the empty spaces together so the JVM can more efficiently allocate large blocks of memory.
How does the JVM know that an object can be swept up and disposed of? Java uses something called reference counters. Whenever code references an object, the JVM increments a counter for that object. Once the code finishes executing, the counter is decremented. When the counter reaches zero, the object is marked for garbage collection, and the collector will sweep it up and dispose of it on its next pass.
There are actually many types of garbage collectors available, depending on the version of Java you run. In the end, they all boil down to two types: minor GC, which runs in the background, frees up unreferenced objects, and major GC, which compacts and reorganizes the heap.
Minor GC is generally not a concern, as it runs in a background thread and doesn’t affect the application at all. Major GC is much more of a problem, as it’s what we call a “stop-the-world” event. All other threads are frozen until a major GC cycle completes. The application completely stops responding to requests. This isn’t much of a problem if the GC cycle takes a few milliseconds. But if it takes much longer, or if the JVM is running major GC cycles constantly, your application will slow to a crawl.
Luckily each collector provides metrics you can watch to tell you what the garbage collectors are doing.
| Bean Name | Attribute Name | Description Name |
|---|---|---|
|
java.lang:type= GarbageCollector |
CollectionCount |
Total number of GC cycles run by this collector |
|
CollectionTime |
Total time spent, in milliseconds |
Again, you mostly need to pay attention to major GC. I usually advise people that more than one or two cycles per minute, or more than 5000 ms in a single minute, means your JVM is seriously unhealthy. Usually this points to a code problem, like a memory leak, or too many objects being created and destroyed when they should be held around for a while.
Threads
Within the JVM, there are lots of threads running various tasks. You’ve already seen that the garbage collectors run in their own threads. Applications will often create thread pools to handle incoming HTTP requests or long-running tasks.
If there are too many threads running, the JVM can spend so much time switching control between threads (in a process called context switching) that the actual application code doesn’t get enough CPU time.
To guard against this, watch the following metrics:
| Bean Name | Attribute Name | Description Name |
|---|---|---|
|
java.lang:type= |
ThreadCount |
Number of threads currently running |
|
PeakThreadCount |
Highest thread count recorded since JVM start |
|
|
TotalStarted |
Total number of threads created since JVM start |
If you see TotalStartedThreadCount climbing rapidly, it may indicate that the application is creating and destroying too many threads. If the CPU usage is also high, you may want to talk to your developers about reducing the number of threads they create.
Application-Specific Metrics
That takes care of some of the most critical JVM metrics. Obviously there are many more than I can cover here, but in my experience, those are the primary sentinels that will warn you when your JVM is in danger of falling over.
But besides these, your application itself (or the container it runs in, such as Tomcat or Weblogic) can also publish JMX metrics. And most of them do!
How do you find out what metrics are available? Fire up a tool like JConsole or VisualVM, attach it to your JVM, and browse the MBeans that are available. Chances are you’ll find some pretty juicy stuff in there.
Here are some hints.
Database Connections
Many application servers provide connection pooling for JDBC databases. Usually they will also expose some MBeans so you can monitor the number of connections in use. Look around for a bean with a type named ConnectionPool or DataSource, or similar.
Request Metrics
Web containers like Tomcat will provide lots of metrics about incoming HTTP requests: how many concurrent connections there are, how long each request takes to process, how many bytes have been received and sent. Request processing time is especially important because it tells you how long users are waiting for a page to load or a request to complete.
Our Tomcat monitoring pack keeps an eye on all of these, plus cache hit ratios and more.
Now that you understand the basics, you’ll be happy to hear we took care of most of the hard work for you.
The Outlyer Java Pack
Out of the box, Outlyer provides a Java Pack that monitors these key metrics and a few others besides. It also calculates some synthetic metrics for you – grouping various GC events into “major” and “minor” garbage collections, for example, and calculating the percentage of heap used.
The pack provides a dashboard that shows the most critical metrics of your JVMs:
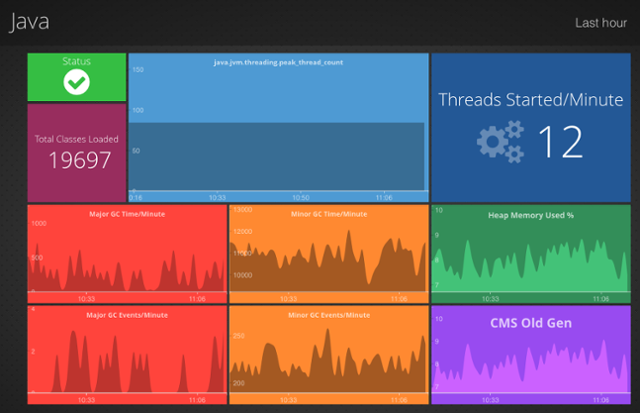 Java Dashboard in Outlyer
The pack also sets up an alert based on some key performance metrics. If any of these criteria are violated, you’ll get an email. Of course you can also set up any of the usual webhooks to post a message to Slack, open an incident with PagerDuty, etc. Here are the standard criteria for the alert:
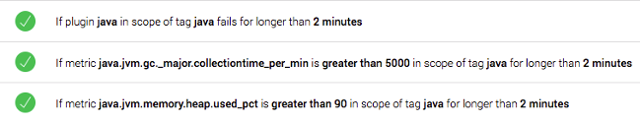 Java Alert Criteria in Outlyer
Why did I choose to alert on these particular metrics? Because, as I explained above in the section on garbage collection,if your heap usage is over 90% or you’re spending more than 5 seconds every minute doing major garbage collections, you’re going to be in for a bad time.
Of course, as with any pack provided by Outlyer, you are free to edit and customize it however you want. You can edit the plugin script to gather additional metrics beyond the defaults, build new dashboards, or set up your own alerts.
Installing the Pack
Installing the Java monitoring pack is super easy:
- Log into Outlyer.
- On the left navigation menu, click “Setup Monitoring”, then “Pack Library”.
- Find the Java pack and click the green Install button.
Setting up the Pack
Next, you have to tell Outlyer to run the pack on the hosts that have JVM’s.
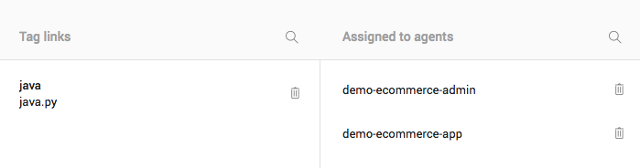
- On the left nav menu, click “Setup Monitoring”, then “Plugins List”.
- Click on the plugin named java.py.
- Flip to the second tab, named “Details & Edit”.
- Use the “+” buttons at the bottom to assign the plugin to run based on hostname or tags. (Tags are preferred.)
Configuring the Pack
Finally, you need to tell the pack how to connect to your JVM’s.
- Assuming you’re still looking at the “Details & Edit” tab, flip back to the “Code Editor” tab.
- Take a look at the script, specifically lines 22-52. Don’t be afraid if you’re not familiar with Python. Everything has comments for you.
- Edit the variables to correspond to your JVM. For example, if you have set up the JMX listener on port 8888, then change the value of JMX_PORTS to (8888).
- At the bottom right corner, select one of your agents and click “Run Plugin” to make sure the plugin works.
- Finally, make sure you click “Save Changes” before leaving the screen.
Here’s what all of the configuration parameters mean:
| Name | Meaning |
|---|---|
| JMX_HOST | Name of the host where the JVM is running. If the agent is installed on the JVM host, you should leave this as "localhost". |
| JMX_PORTS | List of port numbers to probe for a JMX connection. If your JMX listener is not configured on one of these ports, replace the contents of the list with your selected port. |
| JMX_USERNAME | Some JMX connections require authentication. If so, specify the username here. Otherwise, leave it blank. |
| JMX_PASSWORD | Password for authenticated JMX connection. Leave blank if authentication is not needed. |
| JAVA_BIN | Path to the java executable on your system. The default is to search the PATH for the system JVM. |
| SAMPLE_TIME | In order to calculate rate metrics like "GC events per minute", we take two samples a few seconds apart. Increasing the sample time might make the calculations more accurate, but will cause the plugin to take a few extra seconds to run. |
| JMX_URL | The full connection URL. Normally you should not need to change this, as we construct it from the other parameters above. |
| EXTRA_METRICS |
A list of extra MBeans to query besides the standard JVM health metrics. Each entry should be in a specific format like this: 'outlyer_metric_name=mbean_name/attribute_name' Example: 'tomcat.threads.8080.count=Catalina:type=ThreadPool,name="http-apr-8080"/currentThreadCount' |
That takes care of basic JVM health and hygiene. What if you want to capture some metrics that are more specific to your application, like database usage, or even some business KPI’s to impress the bosses?
Capturing Application-Specific Metrics
First of all, use a tool like JConsole to see what MBeans are available. Your application developers might have chosen to expose some application-specific MBeans of their own.
Once you’ve found the metrics you want, copy the ObjectName of the MBean and paste it into the java.py script in the EXTRA_METRICS section, and give your metric a name.
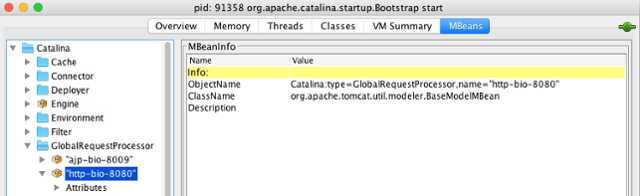
For example, to capture request processing time, you would add this to EXTRA_METRICS:
'tomcat.request_time=Catalina:type=GlobalRequestProcessor,name="http-bio-8080"/processingTime'
Of course, once you have the plugin capturing your metrics, you can then create custom dashboards to show them off, or alerts that fire when the values deviate from expected norms. More on that in a future post.
Conclusion
JMX gives us an easy way to peer inside a running JVM and assess its health without spending a fortune on APM tools. There’s a whole wealth of metrics waiting to be discovered.
One final bit of advice, if I may: set up JMX in your containers now and poke around. You’ll be able to see what normal values look like, which will help you spot the warning signs as soon as things deviate from normal. Good luck!