When you are working with Java applications, or any application running inside a Java Virtual Machine, JMX provides an easy and platform-native way to extract details from the runtime without making any code changes. This article provides some examples of how to access monitoring information using JMX.
What is JMX?
Java Management eXtensions (JMX) are a Java technology that allow management and monitoring of components within a Java Virtual Machine (JVM) runtime environment. Those objects are presented as MBeans (so-called because they are managed JavaBeans). The types of objects that can be managed and monitored include application components, system objects, and even some types of devices. A server application called MBeanServer manages MBeans.
The JMX architecture is designed to be flexible. It allows applications to be extended so that they have custom MBeans. Custom MBeans allow direct management of anything the developers choose, such as cache sizes and configuration settings within the application.
What does the JMX Architecture Look Like?
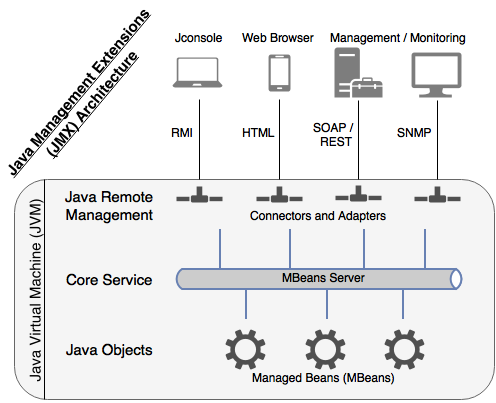
The basic architecture for JMX is that remote agents connect to the remote management layer inside a JVM which is just the term for all the JMX connectors available. The connectors interact with the MBeans Server on behalf of the remote agent and take care of translating from native Java to the protocol the agent wants to communicate with.
The MBeans server is where all the individual java objects (MBeans) register themselves if they are built to be managed via JMX.
 Figure: JMX Architecture (custom made for this article)
Enabling JMX on a JVM
By default, the “com.sun.management.jmxremote=true” runtime property should be set on any JVM. You can therefore access it if you are logged into the same system and as the same user using JConsole or a similar tool.
Agent-based versus Agentless Monitoring
Agent-based monitoring solutions will have a module (typically a JAR file) that needs to be loaded by the JVM during startup, and it will leverage the JMX properties and ship them back to their collection servers. This is what New Relic does, for example.
In contrast, agentless monitoring tools connect remotely to the JVM to gain the same access to the JMX properties. This is the approach that Outlyer takes.
To enable remote access to the JMX functionality, additional properties need to be set for the runtime. At a minimum, a port needs to be configured for the JVM to listen to so it can respond to JMX queries. The runtime property for configuring this is “com.sun.management.jmxremote.port=####”.
Note, too, that if you are running a simple environment for development and testing purposes, disabling security will make life much easier. To to do that, two more runtime properties are required. The security properties to disable security are “com.sun.management.jmxremote.authenticate=false” and “com.sun.management.jmxremote.ssl=false”.
What JMX Runtime Properties are Available?
JMX has various properties are that range from handling authentication, to what port to run on, and several which configure how to work with SSL encryption.
Full details can be found in Oracle’s documentation.
Table: JMX runtime properties default values
| Property | Default Value |
|---|---|
| com.sun.management.jmxremote | true |
| com.sun.management.jmxremote.port | No default. |
| com.sun.management.jmxremote.registry.ssl | false |
| com.sun.management.jmxremote.ssl | true |
| com.sun.management.jmxremote.ssl.enabled.protocols | JVM Defaults |
| com.sun.management.jmxremote.ssl.enabled.cipher.suites | JVM Defaults |
| com.sun.management.jmxremote.ssl.need.client.auth | false |
| com.sun.management.jmxremote.authenticate | true |
| com.sun.management.jmxremote.password.file | JRE_HOME/lib/management/jmxremote.password |
| com.sun.management.jmxremote.access.file | JRE_HOME/lib/management/ jmxremote.access |
| com.sun.management.jmxremote.login.config | Default login configuration is a file-based password authentication. |
What Can I See by Default in JMX?
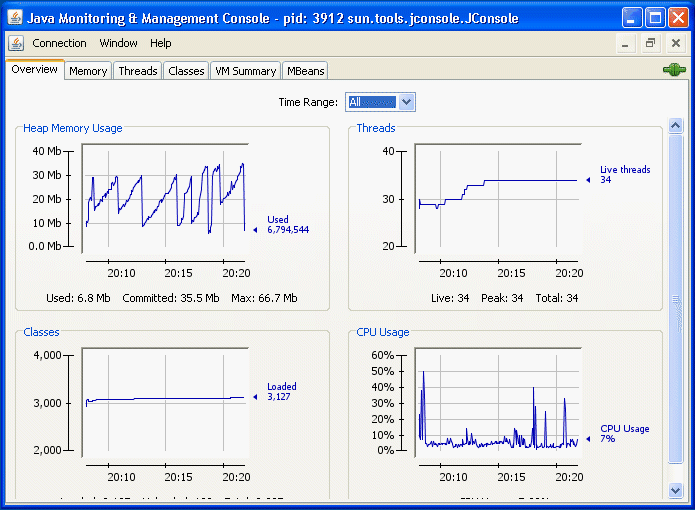
As an example of the amount of information available via JMX for monitoring, when connecting with JConsole, the default view will let you see memory usage, the number of threads, CPU usage, and how many classes are loaded in memory.
 Figure 3-5 from Oracle Java SE JConsole Documentation
JMX can be accessed directly via code, without JConsole. Once the JMX client connects, it can retrieve any available object.
JMX Client Sample Code
import javax.management.*;
import javax.management.remote.*;

public class jmxClient {

 public static void main(String[] args) throws Exception {

   // Connecting to localhost on port 1234
   JMXServiceURL url = new JMXServiceURL("service:jmx:rmi://localhost:9999/jmxrmi");
   JMXConnector jmxConn = JMXConnectorFactory.connect(url, null);

   // Connecting to the MBeanServer
   MBeanServerConnection mbsConn = jmxConn.getMBeanServerConnection();

   // Insert code to query all kinds of objects here
   // Details at https://docs.oracle.com/javase/tutorial/jmx/remote/custom.html

   // And don’t forget to close the connection
   jmxConn.close();

 }

}
Conclusion
As shown here, using JMX provides a solid foundation to any Java monitoring strategy. It is a simple yet also flexible and reliable way to monitor any Java application. If you write or manage Java apps, you should familiarize yourself with the JMX framework–and consider pairing it with a monitoring platform like Outlyer in order to help interpret the Java monitoring data and streamline the setup process. For an example of using Outlyer in conjunction with JMX, check out this blog post.