Open source monitoring can be quite confusing for those who haven’t spent a lot of time reading about the options. At Outlyer, we track the most popular standards and then offer wire-compatible endpoints. This helps new customers migrate onto Outlyer with very little effort, and it means we don’t invent yet another proprietary standard and create vendor lock-in.
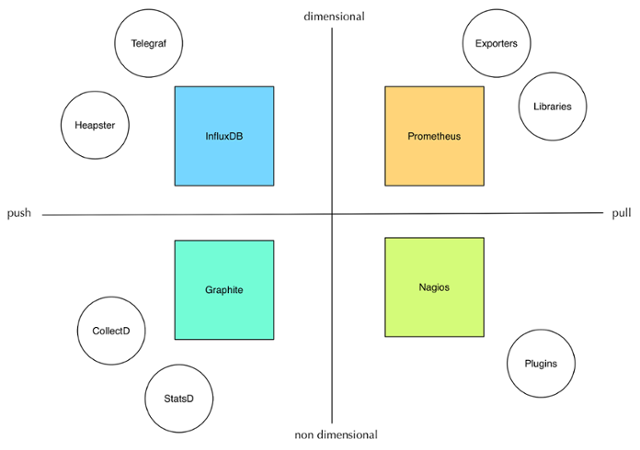
On the surface, it may seem like we support a haphazard collection of random formats. However, some thought has gone into supporting a limited set that cover all bases. We think about these standards across two axis: push vs. pull and dimensional vs. dimensionless.

You can almost think of these as old world vs. new world too, with the old-world formats being Nagios and Graphite which use flat namespaced metric paths.
Nagios plugins are still the best way even in 2016 to quickly monitor some custom piece of your environment. Being able to quickly create a script that returns an exit code and some performance data is still unsurpassed in flexibility. Similarly, being able to write some logic that says “do this, then do this, and now tell me what the result was” is indespensible.
On the push side of the old world, there are still a lot of environments already setup to emit Graphite metrics to a central location. A lot of development teams have already instrumented their code with StatsD and familiarity and adoption should always trump shiny new technology, although I would argue that Graphite is in a lot of ways becoming legacy.
Newer technologies like Prometheus and InfluxDB cover the pull vs .ush segment with dimensional data. Adding key value pairs of tags to metrics makes analytics more dynamic.
Prometheus has a great list of exporters that are especially well suited to monitoring containerised environments. There are also a rich set of client libraries that we believe are a superior way to instrument applications than the traditional StatsD method.
We recently added InfluxDB http API support to Outlyer to cover the final quadrant of push-based metrics with dimensions. Telegraf is a brilliant collection agent that can run across lots of platforms including low-powered IoT devices. With Kubernetes gaining a lot of traction, it’s also incredibly easy to enable the InfluxDB storage driver and with a single line of config post all of those metrics directly into Outlyer.
There are various other metric formats that we’ve looked at but due to lack of tooling or low popularity they have simply remained on our radar. Examples include OpenTSDB and Metrics 2.0.
The majority of customers that we work with already had a mix of the four supported formats setup, and so they didn’t lose any time invested in collection when moving onto Outlyer. When starting from scratch, we have a set of best practices for which collection method to use depending on the scenario.
https://docs.outlyer.com/getting_started/use_cases/
Outlyer allows you to aggregate across each of these axis. A fair bit of engineering effort has been spent combining both worlds into a single application. The benefit to our customers is the chance to reduce the number of monitoring systems they manage down to a select few and to view all of their data in a single place which makes visualisation and alerting much more powerful.