For those of you using the IBM Cloud Kubernetes Service, IBM’s managed Kubernetes offering, you’ll be happy to hear, Outlyer, with its best in class Kubernetes monitoring, has you covered! Outlyer is now on IBM’s Cloud Marketplace and we’ve extended our agent to support IBM Cloud instance metadata so you can see all the details about your nodes in our status views.
If you haven’t used IBM’s Cloud Kubernetes Service, it should definitely be on your list if you’re looking for a managed Kubernetes service. In our testing it was really easy to spin up a cluster, upgrade it and deploy services too in minutes. Now with just an additional 2-3 minutes, you can get complete visibility into your IBM Kubernetes cluster too.
In our example below, we setup a 3 node cluster on IBM Container Cloud and deployed an example microservice application to it to show how easy it is to setup all the application monitoring with Outlyer.
Getting Started
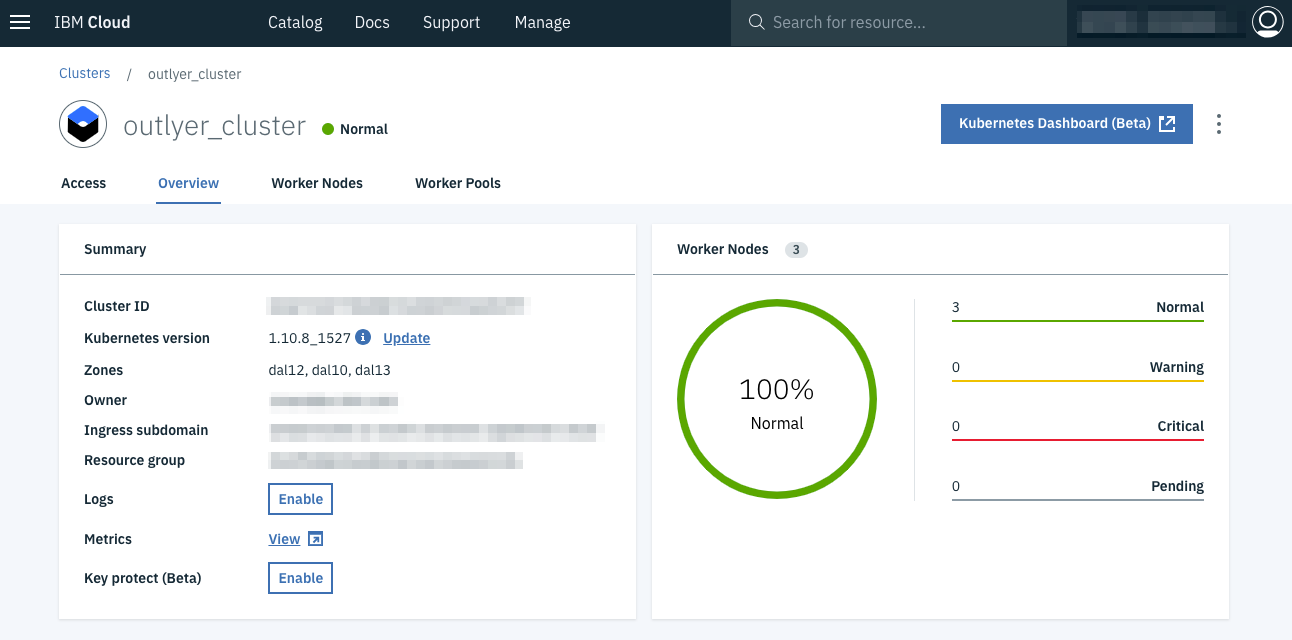
Once you’ve created your IBM Container Cloud Cluster, just follow the instructions on the Access tab of the console to setup
kubectl and then follow the instructions on our Kubernetes Documentation. In less than
two minutes following the instructions, Outlyer should be fully deployed on your cluster and you should be able to see the cluster
in Outlyer and all your Pods soon afterwards:
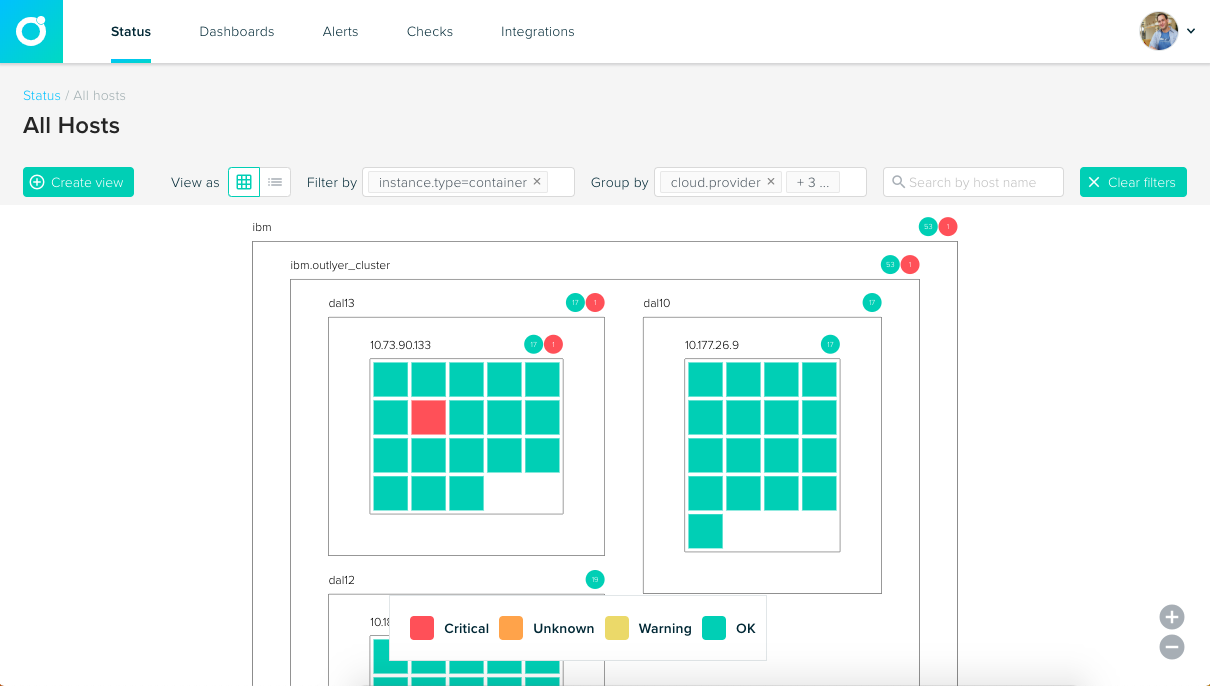
The Outlyer agent automatically picks up the IBM Container Cloud instance metadata so you can select and group your nodes and pods by region, availability zone and other properties about the instance too. In our cluster above, you can see each of our nodes is deployed in a seperate availability zone in IBM’s Dallas region.
The next step is to setup our Kubernetes integration in Outlyer, which using our unique setup technology only takes a couple of clicks. This will install all the plugins, dashboards and views you need to monitor your cluster in Outlyer in only a few seconds:
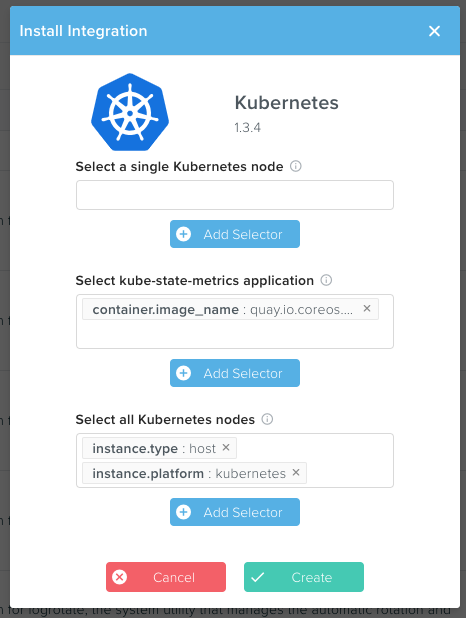
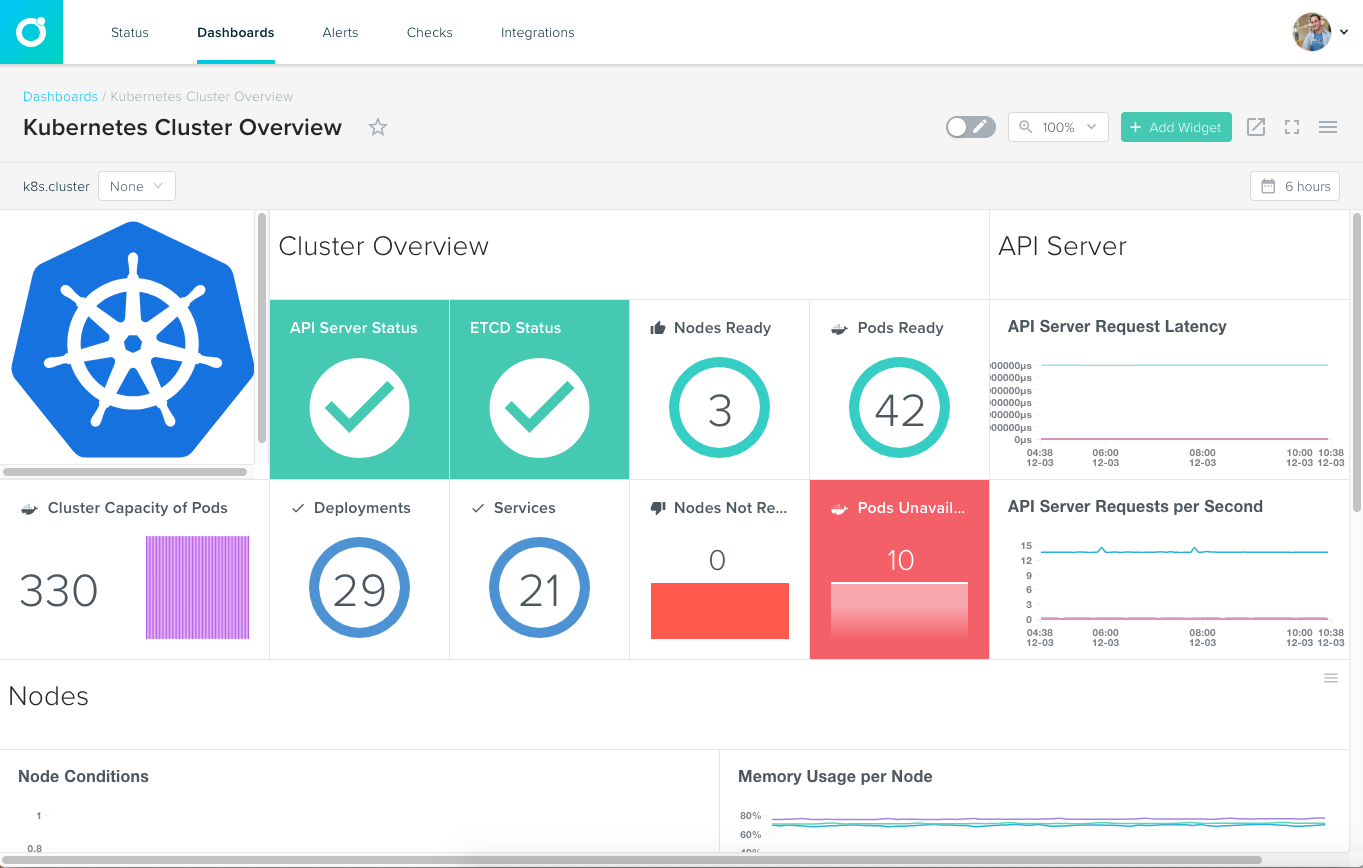
And that’s it, you now have full visibility for your IBM Container Cloud Kubernetes Cluster in less than 5 minutes, and you can just as easily monitor all your application pods and services on the cluster too!
Monitoring Our Microservice Application
For a good example of how easy it is to setup monitoring of the services and applications you deploy on your IBM Container Cloud Kubernetes cluster, I deployed a simple eCommerce application called Sock Shop to the cluster:
kubectl create namespace sock-shop
kubectl apply -f https://raw.githubusercontent.com/microservices-demo/microservices-demo/master/deploy/kubernetes/complete-demo.yaml
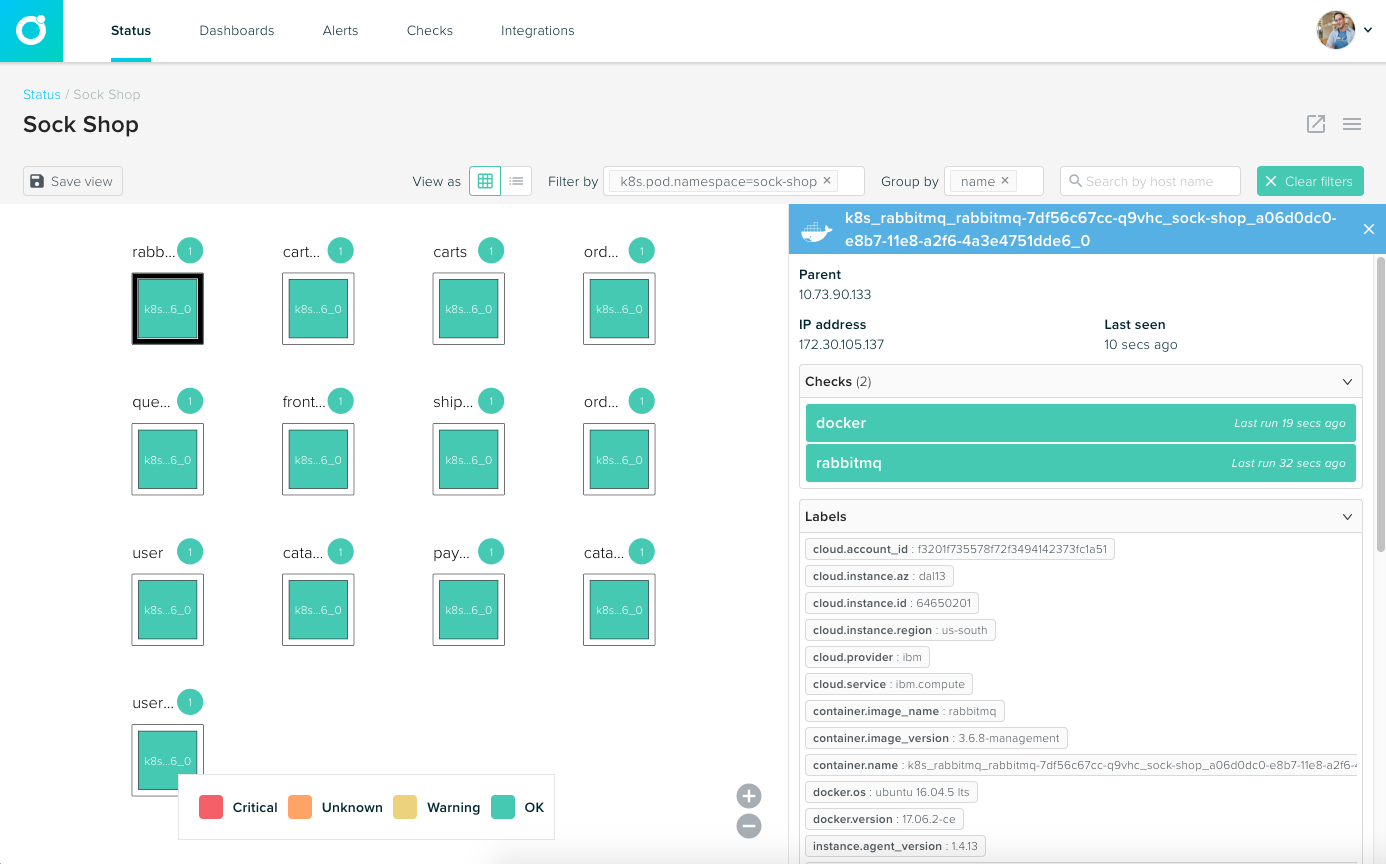
Once deployed I configured a saved Status View in Outlyer so I can see all my Kubernetes Pods organised by service. You can see I have a few MongoDB instances, MySQL, RabbitMQ, and some custom microservices that expose Prometheus endpoints:
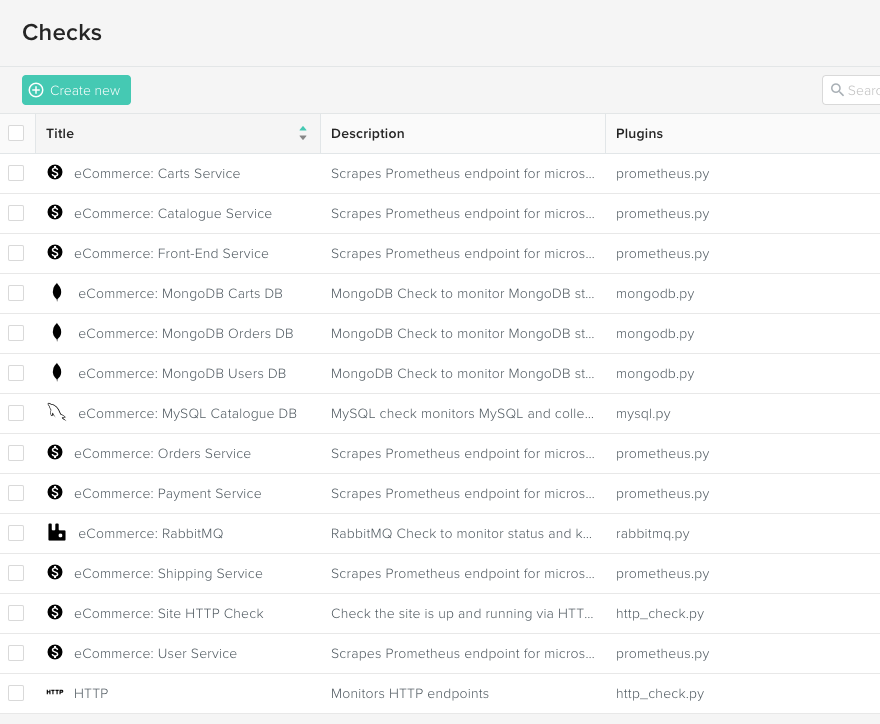
Setting up monitoring for all of these services only takes a few more minutes by installing our out-of-the-box integrations that are automatically setup in the cluster once you configure the integration in the UI using our unique deployment technology as you saw above with our Kubernetes integration. For example, I can setup checks for all the microservice Pods using our Prometheus Integration to automatically scrape all the metrics from their endpoints. With just 4 integrations and 14 checks I can monitor the entire application, and our autodiscovery technology will automatically start monitoring Pods as they come and go:
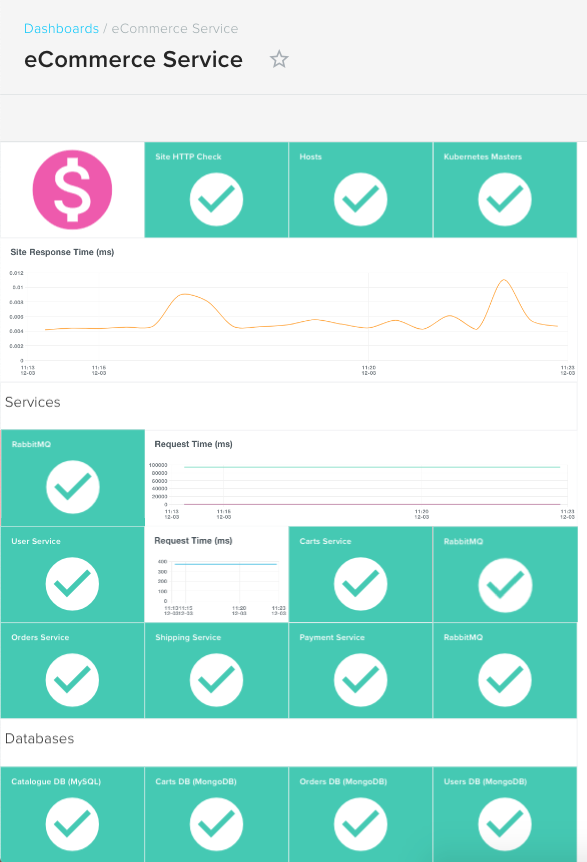
Now I have all my checks configured and service status’s and metrics coming in, I can also create a custom dashboard to show the key metrics and status for all the services running my eCommerce site. Using widget links, I can also link specific widgets to other dashboards so I can easily click through into a more detailed dashboard if I see one of my services is down on the top level dashboard:
And that’s it! In less than 10 minutes we have complete monitoring of your IBM Cloud Kubernetes Cluster and a sample eCommerce microservice application running in the cluster. From there you can start putting your status views and dashboards on TV screens around the office, invite team members, easily setup real-time alerts and use our powerful analytics to explore and understand all the metrics from your Kubernetes cluster and services.