Not a lot of people know this, but our original name, Dataloop.IO, derives from the term OODA Loop (It was either that or OODA Daddy!). OODA Loop is a term I learned about in the Big Data space when we were starting out, and has really driven our thinking around how we’ve designed Outlyer to help online services become more agile and competitive through monitoring.
What is the OODA Loop?
Back in the 1970’s, a United States Air Force Colonel John Boyd got the nickname “Forty Second Boyd” as he had a standing $40 bet with any of his pilots that from a position of disadvantage and his opponent sitting on his tail, he could beat any challenger within 40 seconds in a dogfight. Despite many challengers, he never lost the bet.
His single insight that allowed him to do this was that in a rapidly changing environment, his ability to orient himself, decide and execute on a course of action faster than the environment (or competition) was changing, would allow him to be successful.
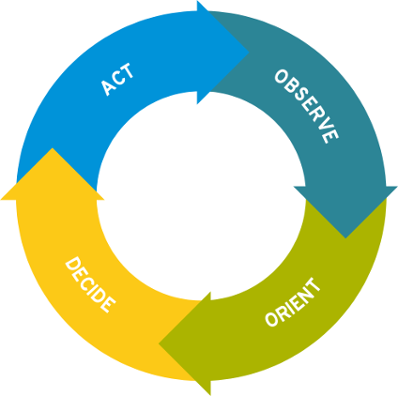
He formalised this concept into what later became known as the OODA Loop – a continuous feedback loop of Observing, Orienting, Deciding and taking Action. By going through the loop faster than his competition, he was able to continuously win any dogfight within 40 seconds.
The OODA Loop consists of the following stages:
- Observe – Assess the current situation and form a hypothesis
- Orient - Gather data and information to validate the hypothesis
- Decide – Develop solutions to address the situation
- Act – Implement solutions

The OODA Loop focuses on agility, providing a construct that allows organisations and teams to continuously respond to fast changing environments. You see this concept being applied in product management (Lean Startup), development teams (Agile Scrum), and in our area of DevOps and Microservices.
As software continues to eat the world, and more of our lives move online, the rate of change continues to accelerate and the companies that are rising to the top are those that can go through the OODA Loop the fastest to quickly iterate and test ideas, and respond to constantly changing environments.
Companies like Amazon.com push 20,000 releases a day across all their products and services, continuously testing and iterating their service to continue satisfying their users and stay ahead of the competition. This is why Amazon has managed to grow so big and threaten some of the worlds largest retailers.
Facebook runs around 10,000 experiments across their platform at any one time, enabling them to test new features and products on their userbase to ensure they stay hooked on Facebook and competitive social platforms don’t pull them away.

All of these companies are applying lean startup, DevOps and scaling these processes via Microservices, enabling them to push new features and code to production faster than ever before and respond to continuously changing competitive landscapes.
In this environment the most critical part of the OODA loop is the Orientation stage. Forming hypothesises of what is happening in the environment without real data leads to faulty assumptions, poor decisions and ultimately unsuccessful actions. Everything must be orientated via real data and the more and better data you have, the more sure you can be that your assumptions stand up and will drive the right decisions and actions.
How the OODA Loop Applies to Monitoring
The OODA Loop above can be applied to monitoring as follows:
- Observe – Decide what you’re trying to monitor
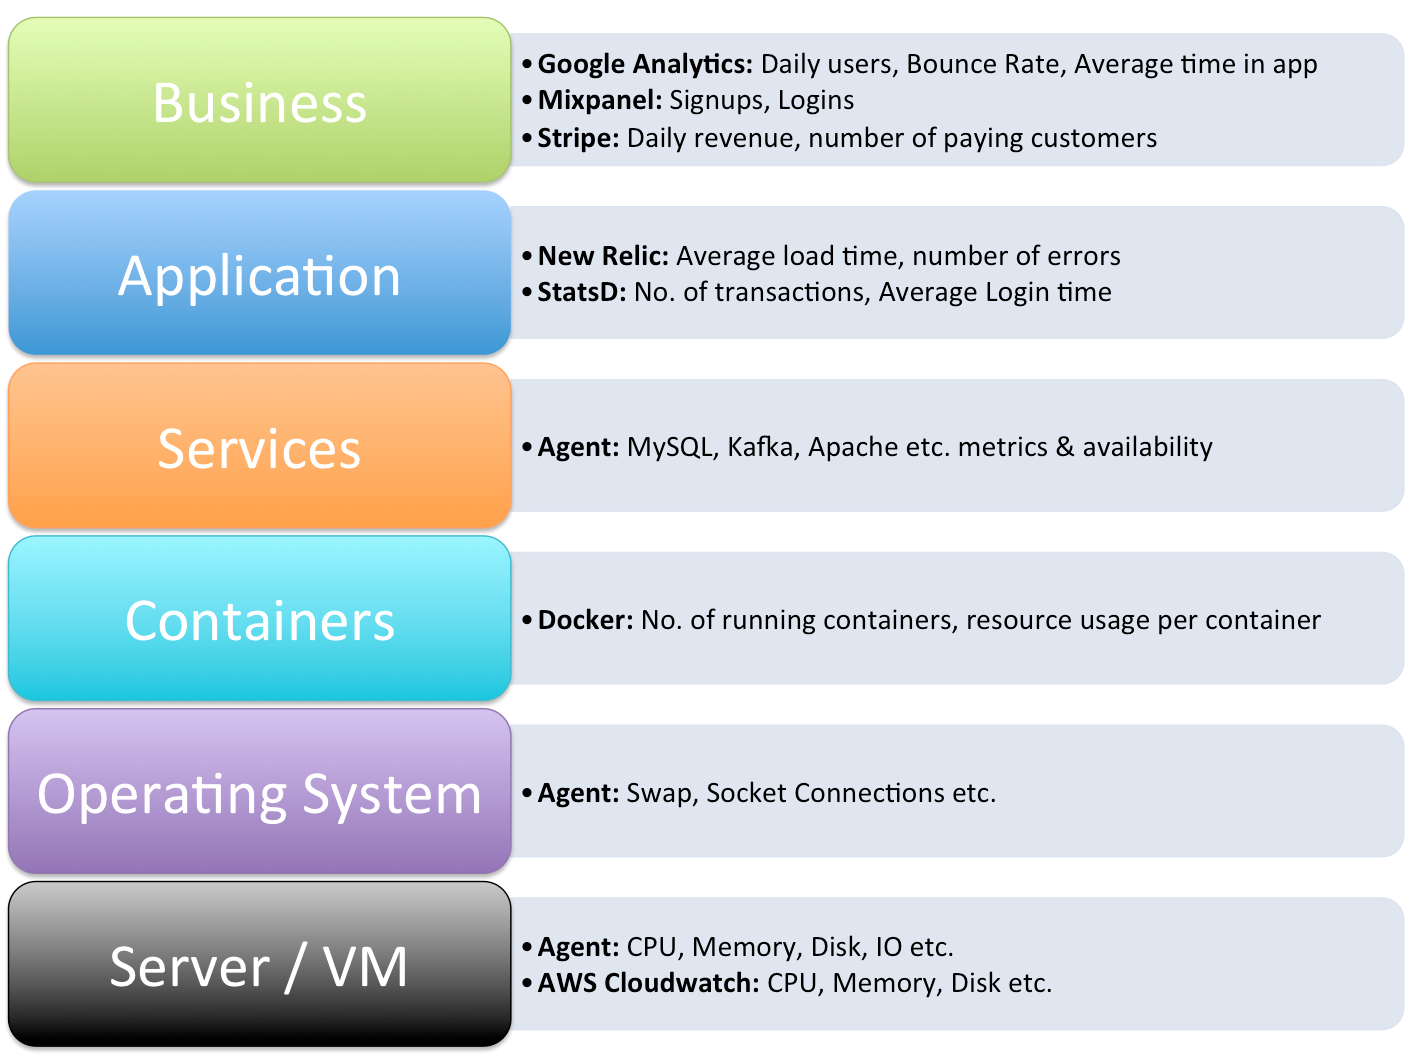
- Orient - Instrument your environment/code to get the metrics you need to monitor the area you need to observe
- Decide – Look at the data through visualisations and graphs to see what’s going on and make a decision on the course of action
- Act – Take action to address the issue, notify the team to take action via Alerts
Monitoring has traditionally been a tool for Operations teams to help them keep their services up and running and get notified when things go wrong. In static data centres and environments where releases are infrequent and the environment doesn’t change much, monitoring used to be a destination. You could set it up once and then leave it running to let you know when things went down.
Today, monitoring has become a journey, there is no end destination. As more companies launch online services to satisfy their customers, they are continuously pushing out new releases of their software, running it on continuously changing dynamic Cloud infrastructure, and the rate of change increases even further with containers.
When they get to scale, they move to Microservices, which now means instead of a single deployment pipeline, they now have multiple teams pushing out deployments of their services into production in parallel.
In this world, nothing stays still, things are always changing, and the movements like DevOps and technologies like Docker are enabling the rate of change to go faster than ever before.
As the rate of change and complexity and scale of our online services increases, the only way teams can make the best decisions and actions to ensure they run a successful service for their users is to Orient themselves with real time data across all their services and infrastructure.
So in the monitoring space you see a big trend towards “measure everything” and real-time so that the teams building and running the software have the visibility and data they need to orient themselves and understand what exactly is going on across all their services and infrastructure.

Scaling issues aside (many companies are finding that the increasing volume of metrics being collected has made monitoring a full time job to manage and scale in house nowadays), one of the biggest challenges we’ve seen in the monitoring space is the friction required to collect the metrics in the first place. While many of the new monitoring tools focus on simple out of the box setup and taking away the burden of building, running and scaling a large monitoring system, none of them really address the friction of collection issue as soon as you step out of their box setup.
How do you quickly instrument your services to ensure you have proper monitoring setup in a constantly changing environment? How do you enable your users to get the metrics they need to see by themselves without waiting on a central operations team to get the data for them?
Ultimately once you know what you want to monitor, how much friction and time does it take you to go from the idea of what to monitor, to seeing that on a graph and actionable alert that you can actually make decisions and take successful action on?
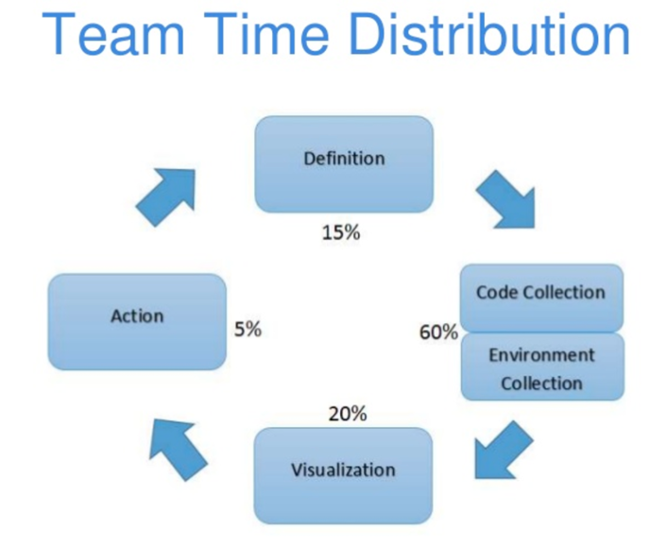
Melanie Cey from Yardi, a large SaaS company in the real estate sector, talked about this exact problem at Monitorama 2015. By their estimates they were spending 60% of their time just orienting themselves to instrument and collect the data they needed in their monitoring tools, so they could reliably test their observations and make the right decisions and take the right actions to improve their online service:
Monitorama PDX 2015 - Lightning Talk - Melanie Cey - Monitoring is Never ‘Done’ from Monitorama on Vimeo.

Source: Monitoring is Never Done Slides by Melanie Cey
We shared that same pain at our previous company, Alfresco, which is what lead us to starting Outlyer (then Dataloop.IO). It didn’t just drive our name but also was a core philosophy that drove our entire product design.
The Friction of Monitoring Collection
Friction presents itself in many ways in the monitoring world so lets focus on a real-life example from one of our customers - finding open ports that shouldn’t have been open across their servers.
One of our customers runs over 500 instances on AWS and woke up one day to find out they’d been hacked. The hackers had opened up ports on a few of their instances, but there was no way to tell which of the instances had been compromised without scanning all the ports across all their servers to see which ones had ports open other than the standard 80/443 ports.
So the Oberservation they needed to make was to tell which of their 500 servers had ports open that shouldn’t have been open.
To Orient themselves with real data they needed to collect the information across all their servers. They decided to write a simple Nagios plugin that would get a list of open ports on the server and alert if any ports other than 80 or 443 were open. On most monitoring tools this would have lead to the following steps:
- Write a plugin on their laptop
- SSH onto a server to test it works
- Add the plugin to their configuration management
- Wait 15 minutes for the next puppet run to deploy the new plugin across all their instances
- Find out the plugin failed on a handful of instances with different operating system versions
- Fix the plugin to work with those instances
- Wait another 15 minutes for the next puppet run
- Finally get the data
Total Time to Orient themselves (Collect the data): 40 minutes
At that point they would then see on the alerts that 6 instances were compromised to make a Decision and then take Action to fix those servers.
In Outlyer, we oriented them in less than 5 minutes.
Even if you don’t suffer from their delays in Puppet runs and having different Linux kernals dotted around your infrastructure, most monitoring tools add friction to the collection process: they don’t support autodiscovery, they require a central Operations team to do all the collection for everyone else adding delays, they don’t support popular Open Source standards which force you to collect data using their smaller ecosystem of proprietory APIs and plugin formats or they have pricing that immediately kicks in the moment you want to add custom metrics.
Whatever the reason, as you add more friction to the collection of metrics, monitoring changes get deffered to the backlog to be done when the team is less busy, and your monitoring starts falling behind the rate of change happening in your environment. At that point you are essentially starting to make decisions without sufficient orientation, which ultimately leads to less successful actions.