This is the first installment of our 3-part “Monitoring Kafka” series. It provides a Kafka overview and discusses how to monitor it using JConsole and Prometheus. Part 2 shows how to monitor Kafka using Outlyer, and Part 3 discusses the important metrics you should be aware of to ensure your Kafka cluster is working properly.
Apache Kafka
Apache Kafka was initially conceived as a high-throughput messaging queue system designed to be fast, scalable, durable, fault-tolerant, and based on an abstraction of a distributed commit log. Since being created and open sourced by LinkedIn in 2011, Kafka has quickly evolved from messaging queue to a full-fledged distributed streaming platform capable of handling trillions of events a day.
Kafka is typically used for the real-time streaming data architectures to provide real-time analytics. Other usages may include messaging system, website activity tracking, metrics collection, monitoring, and log aggregation.
Kafka is being used by more than 2000 firms around the globe, including LinkedIn, Netflix, AirBnB, Microsoft, Yahoo, and Walmart.
Kafka Concepts
In short, Kafka implements a publish/subscribe mechanism where any number of systems that produce data (Producers) publish data in real-time to a Kafka topic. The data is then pulled by any number of systems (Consumers) that subscribe to topics.
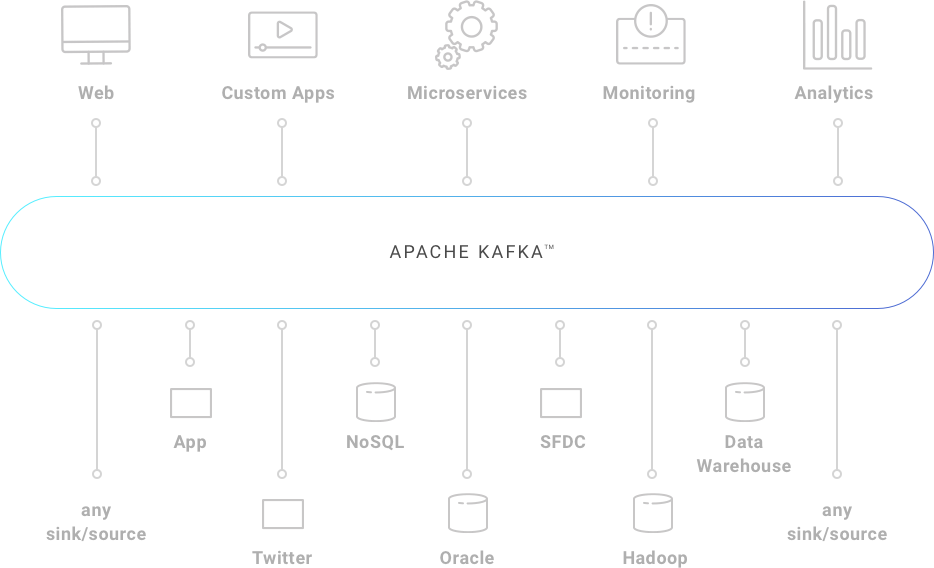
Apache Kafka Pub/Sub (Source: Confluent)
Each node in a Kafka cluster is called a Kafka broker. When a producer sends data to a topic, it is basically appending records to the end of structured logs. A log is a simple storage abstraction where records are appended to the end and reads proceed from left to right. Each entry is assigned a unique sequential log entry number.
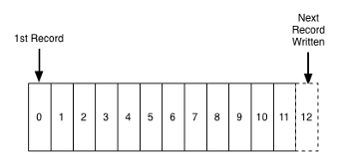 Log Storage Abstraction (Source: LinkedIn)
Topics and Partitions
A topic represents a particular stream of data and is split in partitions. All messages (aka records) within a partition are ordered in the sequence in which they arrive and each message within a partition is associated with an incremental unique id called offset.
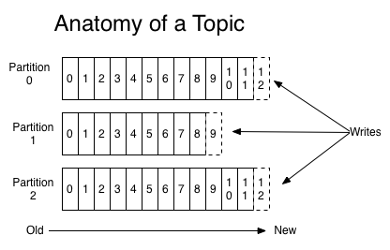 Anatomy of a Topic (Source: Kafka documentation)
Partitions are distributed across Kafka brokers, which means a topic with 3 partitions created in a 3-node Kafka cluster will have a partition on each broker.
Data written to a partition is immutable, which means it can’t be changed. By default, Kafka keeps the data available for consumers for one week long.
If the producer specifies a key in the record, the DefaultPartitioner uses a MurmurHash implementation to determine the partition to which the record should be stored. Every message with the same key lands to the same partition. When no key is specified, the DefaultPartitioner determines the partition in a round-robin fashion.
At any given point in time, only one broker in the cluster is elected as the leader of a partition. The partition leader is responsible for handling all producers write requests and consumers read requests.
When bootstrapping the Kafka cluster, the first broker available becomes the controller, which is responsible for maintaining the list of partition leaders and coordinating leadership elections.
Typically, increasing the number of partitions increases the parallelism, which leads to a higher throughput. However, too many partitions can lead to OS errors due to number of files opened and increased replication latency. Also, if a broker fails uncleanly, a higher number of concurrent leader elections will take place and the topic will not be able to receive and distribute data until the elections are done. If the failed broker happens to be the controller (an unfortunate coincidence, but it may happen), the unavailability period will be even greater because a new controller election must take place before the partition leader elections. Confluent has a great article approaching how to find the appropriate number of partitions for a topic.
It’s possible to increase the number of partitions after a topic is created, however, this is discouraged because the guarantee that messages with same key go into the same partitions would be broken (the MurmurHash implementation takes into consideration the number of partitions to determine the partition).
Replication
Kafka provides built-in replication at topic level by simply providing the replication factor parameter on topic creation time. If a replication factor of 2 is provided, it means that each partition will have 1 leader and 1 replica (in-sync replica or ISR) held in different brokers (considering the cluster has at least 2 brokers, of course).
For example, consider a 2-node cluster and a topic with replication factor of 2. Broker 0 is leader of partition 1 and keeps a replica of partition 2. Broker 1 is leader of partition 2 and keeps a replica of partition 1.
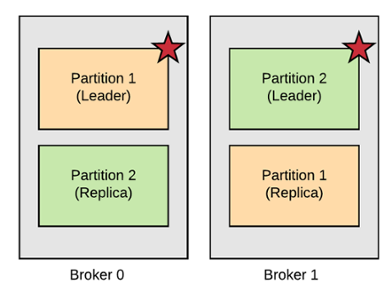 Kafka Replication
If broker 1 fails, a new leader election takes place and broker 0 becomes the leader of both partitions.
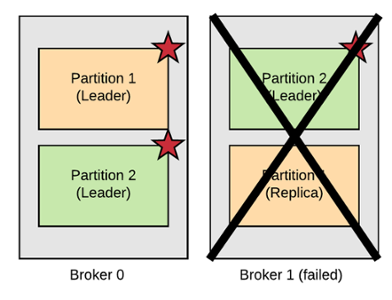 Kafka Fault Tolerance
Thus, a topic with replication factor RF can afford to lose RF-1 partitions without data loss (note that the replication factor cannot be greater than the number of brokers). This replication mechanism makes Kafka fault-tolerant.
A topic with replication factor of 3 is usually a good choice because you can afford to lose 2 nodes, which means for example that 1 node could fail uncleanly and another could be offline for maintenance and the topic would still be available for producers and consumers. However, a too high replication factor will significantly increase write latency, especially if producers acks configuration is set to all (which means all replicas must acknowledge a write for the write to be considered successful).
It’s also possible to increase the replication factor of a topic after it’s created, however, by doing that the nodes receiving the new replicas would probably have their performance affected for a while.
Consumers
Consumers are grouped into Kafka consumer groups to increase parallelism. Each partition is assigned to at most one consumer and a consumer can read from many partitions. Therefore, Kafka does not allow a consumer group to have a greater number of consumers than the number of partitions.
Within a consumer group, who determines which consumer will read from each partition is the consumer group leader, which is also responsible for running a partition rebalance event in case of a new consumer joins or left the consumer group.
After polling messages from a topic, a consumer can either automatically (the default) or manually commit the offset back to the broker, who will append that to a special compacted Kafka topic named __consumer_offsets that keeps track of the last consumed message by the consumer for that partition. This allows a failed consumer to continue polling messages from where it left off.
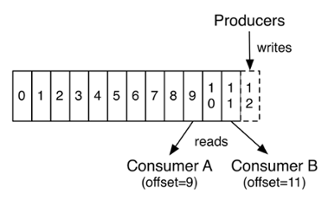 Commited Offset (Source: Kafka documentation)
Depending on how the offset is committed by the consumer, Kafka can operate on at most once or at least once message delivery semantics. As of Kafka release 0.11, exactly once semantic is also possible.
Zookeeper
Zookeeper is a centralized service for maintaining configuration information, naming, providing distributed synchronization, and providing group services.
Zookeeper is used in Kafka and many other relevant projects like HBase and Solr. For example, HBase uses ZooKeeper for master election, lease management, etc. Solr uses ZooKeeper for leader election and centralized configuration.
Zookeeper plays a very important role in Kafka architecture since Kafka cannot work without Zookeeper.
In Kafka, Zookeeper is used to persist brokers and topics metadata, managing controller elections, leader elections, sending notifications to Kafka in case of changes (e.g. new topic is created, broker dies, broker comes up, topic deletion, etc), and so on.
Zookeeper implements a leader/follower architecture and Kafka usually operates in an odd quorum of servers. Typically, a 5-node Zookeeper cluster is used in production as it would allow 2 nodes down at any time.
Why Care About Kafka Monitoring?
Kafka implements a complex architecture and introduces tons of new concepts. As you may guess, ensuring that a Kafka cluster is working properly is not an easy task. Besides, a proper Kafka monitoring should also include Zookeeper.
In the next sections, we are going to visualize Kafka Metrics using JConsole and learn how to monitor Kafka using Prometheus. The next post of this series will show how to monitor Kafka using Outlyer.
Visualizing Kafka Metrics via JMX
Kafka exposes metrics via JMX (check out our article on JMX). These metrics can be visualized using JConsole (or any other JMX client, like VisualVM), a simple Java GUI that ships with the Java Development Kit (JDK). JConsole uses the extensive instrumentation of the Java Virtual Machine (JVM) to provide information about the performance and resource consumption of applications running on the Java platform.
Supposing you have JDK properly installed and a Kafka broker running on localhost and exposing JMX port 9581, just execute the command jconsole localhost:9581 on terminal and JConsole should pop up.
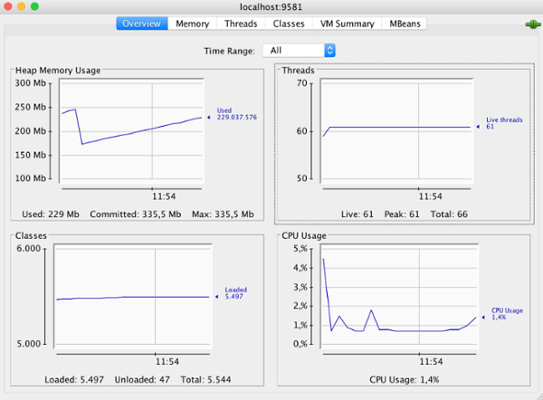 JConsole Overview Tab
Using VisualVM is pretty similar, except that you have to install the MBeans plugin to visualize the MBeans tab (whereas JConsole already ships with it), which is used to display attributes, operations, and notifications related to custom MBeans.
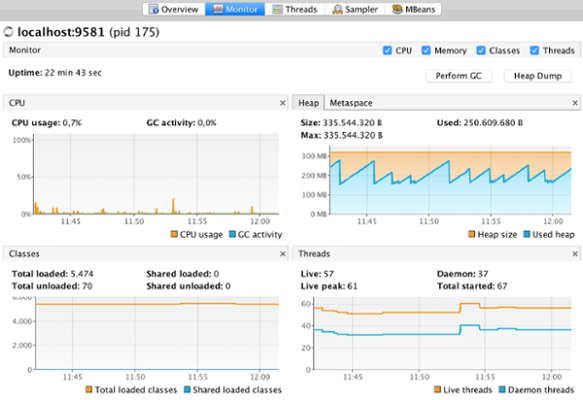 VisualVM Monitor Tab
The MBeans tab exposes tons of metrics about the underlying OS, JVM and Kafka itself. Below is shown the Garbage Collector attributes (collection count, collection time, etc) related to G1 Young Generation.
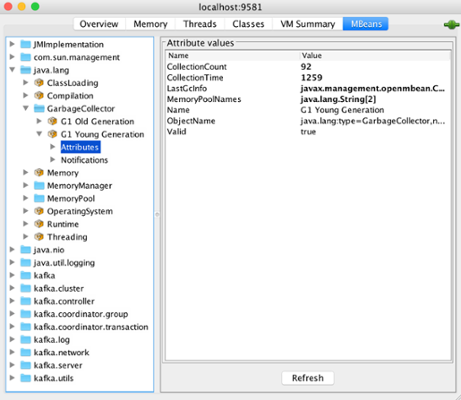 MBeans: G1 Young Generation
Exploring the kafka.server domain and the ReplicaManager type you can find the UnderReplicatedPartitions metric name. If this metric has a value greater than 1 it means that data is not being replicated to enough number of brokers thereby increasing the probability of data loss. You will learn about the important Kafka metrics to be aware of in part 3 of this Monitoring Kafka series.
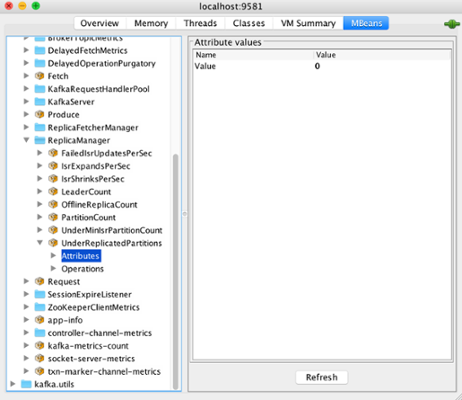 MBeans: Under Replicated Partitions metric
Similarly, producers and consumers can also expose metrics via JMX that can be visualized by repeating the exact same process show above.
While JConsole and VisualVM are great tools for quickly visualizing metrics, production environments typically require full-featured monitoring tools with real-time alerting capabilities.
Monitoring Kafka with Prometheus
Prometheus is an open source pull-based systems monitoring and alerting tool that started in SoundCloud in 2012 and joined the Cloud Native Computing Foundation in 2016 as the second hosted project, after Kubernetes.
Prometheus scrapes metrics from various targets that expose metrics on Prometheus format on a predefined time interval, stores them into a local on-disk time-series database and let you do useful things with them like querying with PromQL, alerting with Alertmanager and creating custom dashboards in Grafana (which provides a native Prometheus data source).
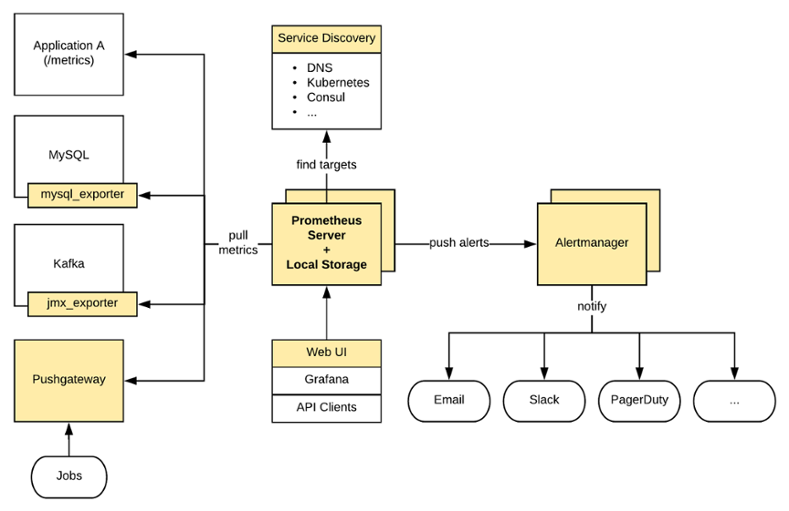 Prometheus Architecture
An application can expose its metrics in Prometheus format using a Prometheus Client Library. For other services that don’t expose metrics in Prometheus format (like Kafka, Linux servers, MySQL, etc), Prometheus exporters can be used, like the JMX exporter for Kafka.
The JMX exporter allows to scrape and expose MBeans of a JMX target. It’s recommended that this exporter run as a Java Agent on alongside each broker, exposing an HTTP server and serving metrics of the local JVM to be consumed by Prometheus.
The JMX exporter configuration file includes rules as shown below. Here you can see an example of a full JMX exporter configuration file for Kafka.
rules:
- pattern : kafka.server<type=(.+), name=(.+)><>(Count|Value)
  name: kafka_server_$1_$2
This rule, for example, allows JMX exporter to collect the UnderReplicatedPartitions metric mentioned earlier. This metric is then exposed over HTTP in Prometheus format:
# HELP kafka_server_replicamanager_underreplicatedpartitions Attribute exposed for management (kafka.server<type=ReplicaManager, name=UnderReplicatedPartitions><>Value)
# TYPE kafka_server_replicamanager_underreplicatedpartitions untyped
kafka_server_replicamanager_underreplicatedpartitions 0.0
After setting up Grafana with the Prometheus data source, you can create dashboards and graphs based on the scraped metrics.
 Grafana Dashboard
Alerting can be done via Alertmanager rules configuration, for instance:
groups:
- name: kafka
  rules:
  - alert: UnderReplicatedPartitions
    expr: kafka_server_replicamanager_underreplicatedpartitions > 0
    for: 30s
    labels:
      severity: critical
    annotations:
      summary: Number of Under Replicated Partitions is greater than 0
Conclusion
In this article, you have learned Apache Kafka main concepts, how to visualize Kafka metrics via JMX using JConsole, and how to monitor Kafka using Prometheus.
Monitoring Kafka with Prometheus requires JMX exporter to run alongside each broker in order to expose metrics in Prometheus format. By using Grafana set up with the Prometheus data source, it’s possible to create custom dashboards. Alerting can be performed via Alertmanager.
In the next post, you are going to learn how to monitor a Kafka cluster using Outlyer, which provides full out-of-the-box Kafka monitoring so you can focus on your business and let all complexity related to monitoring on us.