In 2017, we saw the rise and eventual takeover of the container orchestration tool, Kubernetes. Although a lot of great alternatives exist such as Docker Swarm, Mesos and Amazon ECS, Kubernetes became the leader for running containers at scale. Its benefits are that it’s Cloud native (it was designed to run applications at scale on Cloud platforms) and the ability to provide a virtual abstraction layer on top of Cloud providers enabling users to deploy their applications consistently between Cloud providers.
We at Outlyer now run a majority of our monitoring service using Kubernetes (K8s), something we migrated to very quickly from start-to-finish in about 6 weeks over the summer. Despite the steep learning curve, we continued pushing forwards and now benefit from all the power that Kubernetes can provide us to run a resilient, highly available and scalable monitoring service.For those of you who may also be starting your journey on Kubernetes, here is our definitive guide to monitoring K8s.
Why Kubernetes Monitoring is Hard?
Kubernetes is a complex beast. Its breadth of functionality grows daily and is enough to overwhelm even the most advanced users. With all monitoring, understanding the basic components of the system you’re monitoring and what they do helps understand what we need to monitor and how to troubleshoot issues when they occur.
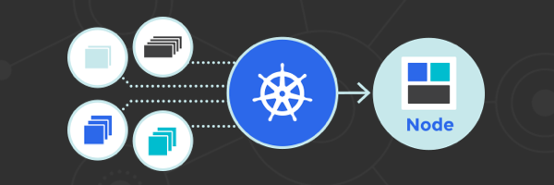
As an orchestration tool, the Kubernetes Master keeps an eye on all the workloads running on the cluster in real time and continuously load balances and shifts containers around the cluster’s Nodes to respond to failures (i.e. a server crashing will move all the containers automatically to another server to ensure the application stays up and running) or resource limits (a server is being over-utilized so K8s will rebalance containers across the servers to spread the load).
Your monitoring tool needs to support service discovery in its configuration, as you have no idea where a container will be deployed in the cluster. If you watch a large Kubernetes cluster running, I compare it to Whack-a-Mole, where your containers are continuously disappearing and popping up across Nodes in your cluster. For one of our customers, we saw containers moving around every 6 minutes across their nodes, making monitoring Kubernetes much harder than traditional applications!
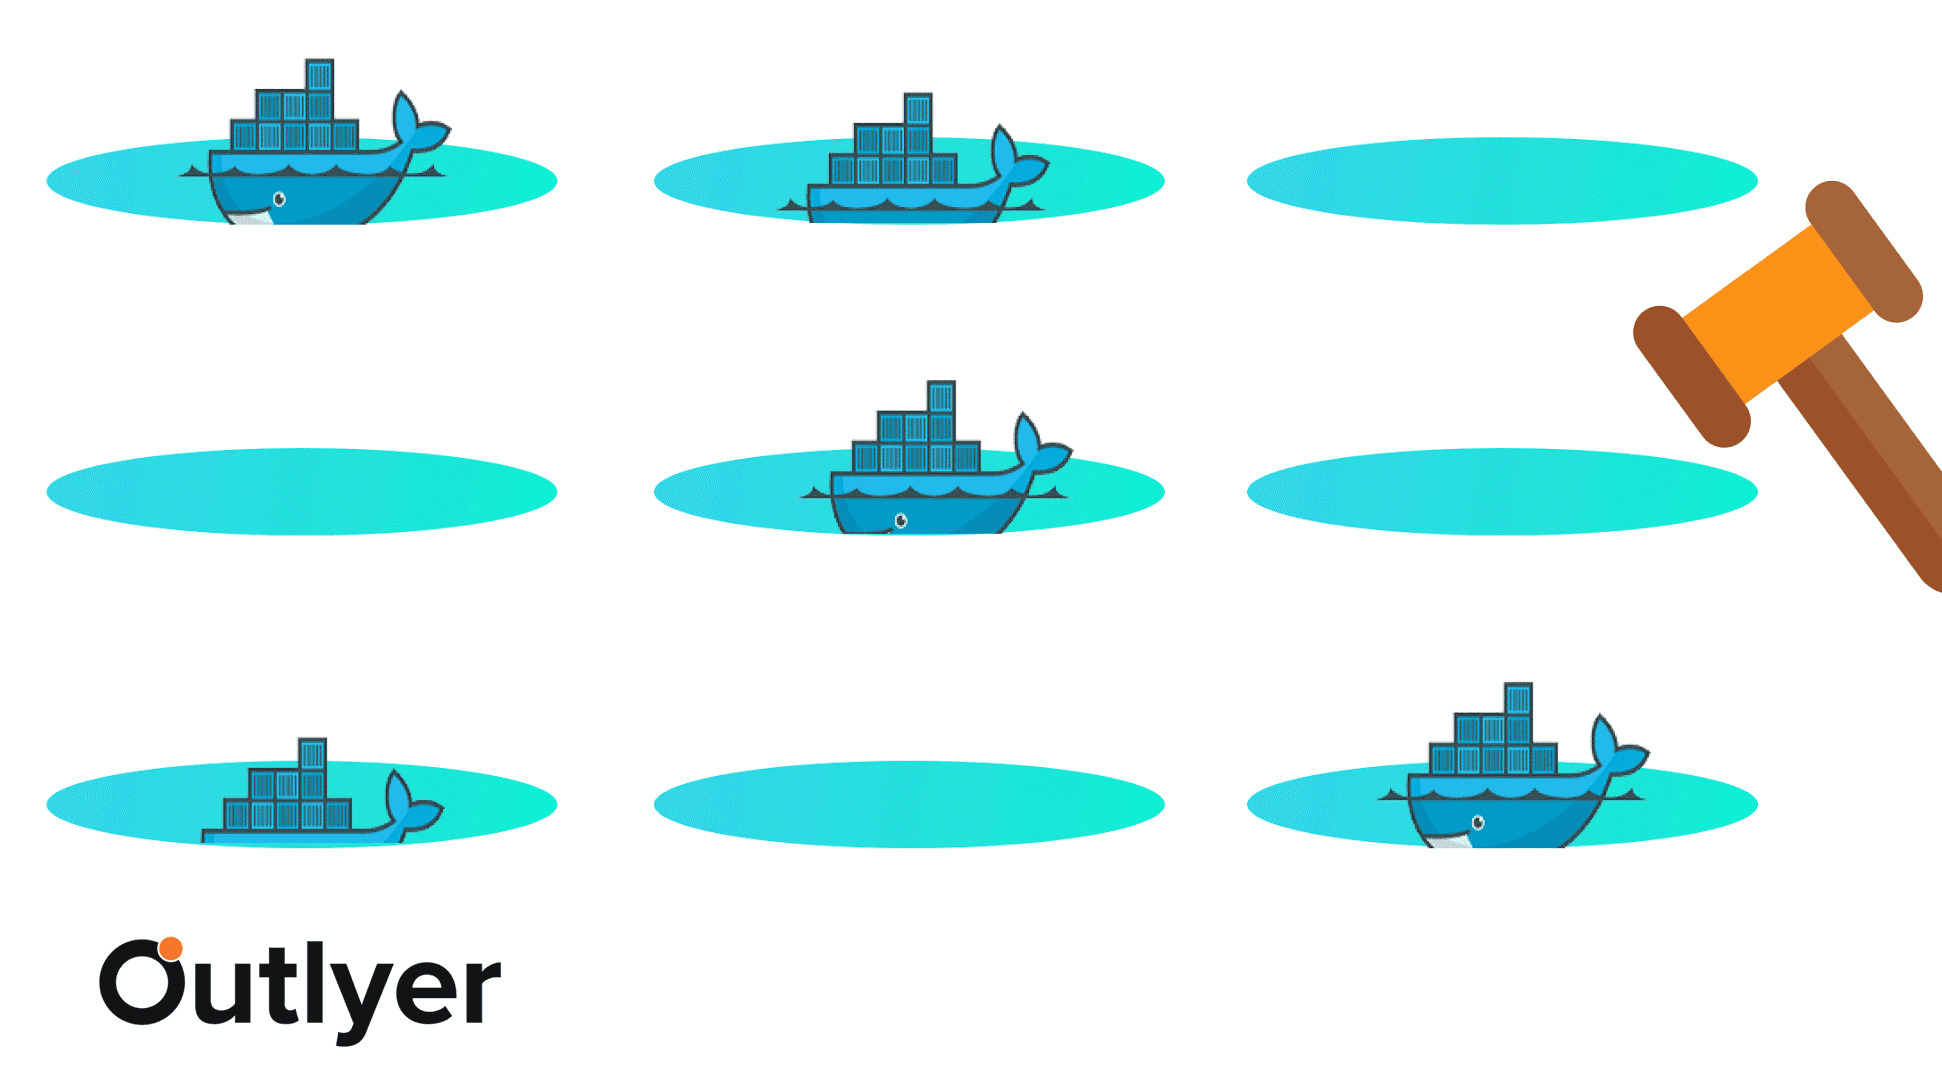
This basically changes how your monitoring tool needs to work, making a lot of the traditional monitoring tools we’ve used in the past redundent when moving to Kubernetes:
- Your monitoring needs to be Kubernetes aware so your metrics and events are organized around Kubernetes resources such as Pods, Services, Namespaces etc. and you can filter your metrics and events to specific resources when troubleshooting.
- Your metric cardinality goes up exponentially through a process called series churn. If you imagine every container generates its own series of metrics (typically around 50-100 unique metrics per container), each time a container dies and is replaced, you’re essentially adding another 50-100 metrics to your monitoring time-series database, which will start growing exponentially, creating performance problems quickly if you don’t design your monitoring solution around this issue.
- As Kubernetes clusters can run across multiple data centers and Clouds, it can get quite hard to aggregate all of your monitoring into one centralized tool that can allow you to dive into where nodes are actually running as well as showing you the status of the entire Cluster.
Interested in trying Outlyer for monitoring Kubernetes? We offer a 14-Day Free Trial – No credit card needed, get set up in minutes. Read The Docs to get started in minutes.
Kubernetes – The Core Concepts
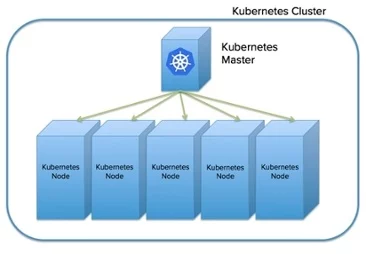
At its core, Kubernetes provides a master server, which acts as the central orchestrator for the cluster, and ‘Node’ servers which run the container workloads across our cluster. In a most basic setup, you will generally have one Master and 3 Nodes so your workloads can continue working even if one of your Nodes fails.
As stated previously, Kubernetes creates virtual resources that abstract your application workload when its run on the cluster Nodes. The main ones are:
-
Pods – Pods are created by deployment configuration files in Kubernetes. A Pod is a Kubernetes abstraction that represents a group of one or more application containers and some shared resources for those containers such as:
-
Shared storage, as Volumes
-
Networking, as a unique cluster IP address
-
Information about how to run each container, such as the container image version or specific ports to use
-
-
Nodes run Pods, and Kubernetes manages the workload across Nodes at the Pod level. This means your individual Pods will always run all their containers and resources on a single Node. Pods in effect are the smallest unit of abstraction in Kubernetes so when you scale up and down your application deployments, you’re essentially launching and terminating Pods.
-
Labels – Labels are key/value pairs that can be assigned to Pods to help group and filter Pods such as ‘application=mywebapp’. Labels are used by Services to select which Pods should be exposed through the Service. They can also be used to help us filter our monitoring metrics and events.
-
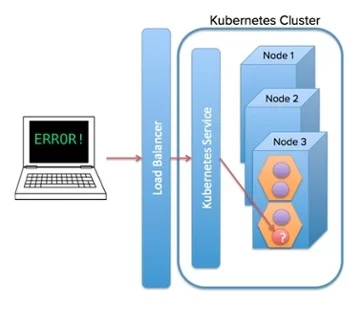
Services – While containers in Pods can communicate with each other, and different Pods inside the cluster can also communicate with each other through Kubernetes internal network across the cluster, you need a service to expose the Pods publically so that external users can access your application from outside the Kubernetes Cluster. A service handles all the networking complexity to expose a Pod’s application ports internally to a load balancer and IP address which can be accessed externally by users outside your Cluster.
Because Kubernetes will essentially ensure your Pods are kept running and are dynamically rebalanced across Nodes based on their resource requirements, the service provides the static endpoint that ensures your users can easily access your application Pods regardless of where or how many of your Pods are running in the Cluster.
-
Namespaces – For larger Kubernetes users, Namespaces enable you to share a single K8 cluster across multiple teams/applications/environments, providing some virtual separation between them. For example, you may setup Namespaces for your dev, staging and production environments, so you can manage the Pods running in them independently while allowing all your environments to share the same Nodes, allowing for higher utilization and cost savings as you won’t require as many Nodes to run all your environments.
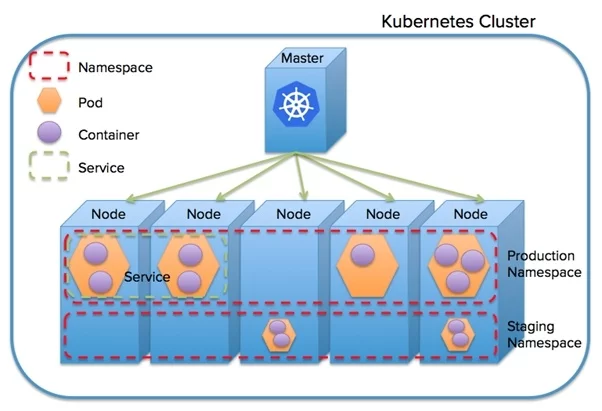
From a monitoring perspective, you will want to ensure all your metrics and events are labelled and organized by Namespaces, Nodes, Pods, Services and Containers so your monitoring can alert and visualize what’s happening at each level:
Kubernetes – The Core Components
So how does Kubernetes work behind the scenes to manage all the containers, Pods, Services, Namespaces and other ever-growing list of resources?
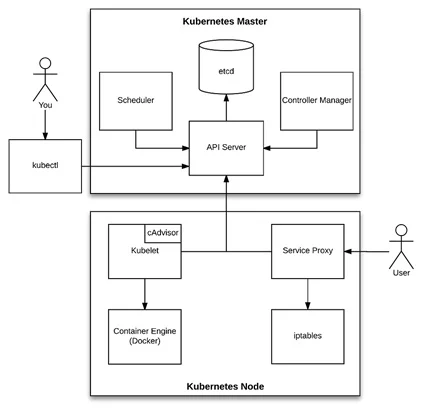
Masters:
-
etcd: etcd is a distributed, consistent key-value store used for configuration management, service discovery, and coordinating distributed work.
When it comes to Kubernetes, etcd reliably stores the configuration data of the Kubernetes cluster, representing the state of the cluster (what nodes exist in the cluster, what pods should be running, which nodes they are running on, and a whole lot more) at any given point of time.
-
API Server: When you connect to your Kubernetes cluster using the command line too (kubectl) or Kubernetes Dashboard, they are both connecting to the cluster via the API Server on the Master server.
The API Server is the main management point of the entire cluster. In short, it processes REST operations, validates them, and updates the corresponding objects in etcd. The API Server serves up the Kubernetes API and is intended to be a relatively simple server, with most business logic implemented in separate components or in plugins.
The API Server is the only Kubernetes component that connects to etcd; all the other components must go through the API Server to work with the cluster state.
-
Controller Manager: The Kubernetes Controller Manager is a daemon that embeds the core control loops (also known as “controllers”) shipped with Kubernetes. Basically, a controller watches the state of the cluster through the API Server watch feature and, when it gets notified, it makes the necessary changes attempting to move the current state towards the desired state. Some examples of controllers that ship with Kubernetes include the Replication Controller, Endpoints Controller, and Namespace Controller.
-
Scheduler: The Scheduler watches for unscheduled pods and binds them to nodes via the /binding pod subresource API, according to the availability of the requested resources, quality of service requirements, affinity and anti-affinity specifications, and other constraints. Once the pod has a node assigned, the regular behavior of the Kubelet is triggered and the pod and its containers are created
Nodes:
-
Kubelet: The Kubelet is one of the most important components in Kubernetes. Basically, it’s an agent that runs on each node and is responsible for watching the API Server for pods that are bound to its node and making sure those pods are running. It then reports back to the API Server the status of changes regarding those pods.
The Kubelet also has a tool called cAdvisor built into it. cAdvisor is a container auto-discovery and monitoring tool that essentially builds a list of all the containers running on a server and pulls out all the key metrics for each container (such as CPU, memory, disk, IO usage).
The Kubelet also has an internal server on port 10255, which exposes some REST API endpoints for debugging, including all the metrics collected via cAdvisor.
-
Service Proxy: The Service Proxy runs on each node and is responsible for watching the API Server for changes on services and pods definitions to maintain the entire network configuration up to date, ensuring that one pod can talk to another pod, one node can talk to another node, one container can talk to another container, and so on. Technically it programs iptabels on the nodes to trap access to the service IP address.
-
Container Engine: This is the container service such as Docker or Rocket, which is responsible for downloading Container images and running and managing the containers under the control of the Kubelet.
As you can see above, there are at least 7 processes that we need to monitor across the servers in our Cluster to ensure that Kubernetes is running as expected, even before we start monitoring the actual Containers and Pods that are being scheduled and run across the Cluster. As I said – Kubernetes is a complex beast!
Monitoring Kubernetes
The great thing about Kubernetes is because it’s a powerful orchestration tool, we get a lot of protections built in for free such as automatically restarting Containers if their process crashes, or re-balancing Pods in the Cluster if a Node goes down, saving us a lot of time having to troubleshoot and fix issues that would typically cause downtime.
However, for those cases where Kubernetes can’t automatically fix a problem, or we need visibility to understand a performance issue with our application, we will still need monitoring to provide the visibility we need across the Cluster and help us make sense of all the metrics and events it generates.
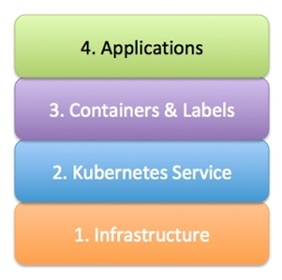
The rest of this article will be broken up into the individual layers we need to monitor to get full visibility into the health of our Kubernetes cluster:
-
Infrastructure: If the underlying infrastructure and servers running the Clusters are having problems this will impact the workloads running on top so we need to ensure we have visibility at the server level.
-
Kubernetes Service: If the Kubernetes Master(s) is having problems we need to know about that otherwise our orchestration will stop working, and the entire Cluster will fall over. Primarily we need to ensure the Controller and Scheduler are able to keep our Pods running in their desired state and etcd is working to ensure the Cluster state is stored accurately in our Cluster.
-
Containers & Labels: As everything in the Cluster is running inside a container, we need to be able to pull out all the important container metrics and events for each container so we can see how our Containers are performing. To ensure we can understand our container metrics and events in the context of Kubernetes, we need to ensure that we discover and apply all our resources and labels from Pods, Services and Namespaces etc. to ensure our metrics and events are labeled in a waywe can make sense of them in the context of these resources.
-
Applications: In the end, all the other layers are there to support running your applications in the clusters, and those application services need monitoring too. Now that you’ll be running NGinX and potentially databases like MySQL inside your cluster, alongside your own application code, which may have its own custom metrics and events, we will need a way to monitor those too.
1. Infrastructure Monitoring
For each of the servers in your Cluster, both Master and Node servers should have basic monitoring in place so you can see if the underlying infrastructure is working as expected:
-
CPU utilization: To ensure we have enough processing capacity to run our Cluster.
-
Memory utilization & Swap: To ensure we have enough memory capacity to run our Cluster and aren’t hitting performance issues by using Swap memory.
-
Disk utilization & I/O: To ensure we have enough disk space to run our applications and store useful troubleshooting data such as logs.
-
Network I/O: To determine any major latency in the network, as oftentimes the effects of traffic spikes may be amplified by network latencies.
2. Kubernetes Service
As described above, we need to ensure that the components of our Kubernetes Master processes are up and running and working as expected. In addition we need to ensure etcd is running as expected to keep the Cluster state in sync.
In Kubernetes, we use the API Server to query the health of our Cluster and pull out the key metrics and events using the REST APIs it provides. If our monitoring can’t make requests to the REST API then we know that the Master has gone down or stopped working correctly and we will need to investigate.
As etcd is the primary data store for all of the Cluster’s resources and state, it is essential that we also monitor etcd to ensure its keeping up with the number of writes/reads from the Kubernetes master and is keeping things in sync across all the Nodes it is running on.
Etcd provides a REST API endpoint for pulling out its key performance metrics so we can monitor the service:
$ curl -L http://localhost:2379/metrics

# HELP etcd_debugging_mvcc_keys_total Total number of keys.
# TYPE etcd_debugging_mvcc_keys_total gauge
etcd_debugging_mvcc_keys_total 0
# HELP etcd_debugging_mvcc_pending_events_total Total number of pending events to be sent.
# TYPE etcd_debugging_mvcc_pending_events_total gauge_ etcd_debugging_mvcc_pending_events_total 0
...
The above endpoint is actually exposing its metrics in Prometheus’s exporter format, which makes it easy to poll and scrape using various monitoring tools. A full overview of all the metrics available and what they mean from etcd is beyond the scope of this article, so for now we will assume we just need to monitor the service on every Master node in Kubernetes and will come back later to etcd metrics in a separate article.
3. Containers & Labels
Container’s can essentially be thought of as mini-hosts running on each Node. This means at a minimum we need to be able to understand all the key resource metrics at a container level such as CPU, memory and Network I/O, to ensure the container is running correctly on the Node.
As discussed previously, each node runs a Kublet agent that manages all the containers on each Node, and also has cAdvisor built into it. cAdvisor monitors at the cGroups level on the Node, meaning it can automatically discover all the containers on the Node and pull out all the metrics for that container directly from the underlying Operating System, regardless of which container engine, Docker or Rocket, is being used to run the containers.
The Container metrics, events and their metadata can be pulled via the Kubernetes Summary API on the API Server:
kubectl proxy & http://localhost:8001/api/v1/proxy/nodes/{NODE_NAME}:10255/stats/summary
Using the Kubernetes API’s we can extract the entire running resources and their settings and metadata to add more context to our container metrics and events.
When we collect the container metrics and events we need to ensure they are properly labeled so they can be filtered and grouped by Node, Pod, Service and Namespace (for larger clusters) so we can organize our metrics and events around the same virtual resources that Kubernetes is managing.
4. Applications
Our applications run inside the containers running on each Node. Containers could be running 3rd party Applications such as NGinX, Redis, MySQL etc. or a custom application written by our own developers.
In either case we now need to monitor the applications inside the container to collect metrics and events from them so we can get the visibility we need to monitor them.
In the case of 3rd party Applications, typically a plugin will be used to pull metrics from the Application’s own monitoring endpoints.
For our own custom Applications, our developers will need to write and expose the metrics they want to see via JMX (for Java applications), or typically push metrics via StatsD or provide Prometheus endpoints that can be scraped. All these metrics need to be collected for analysis and correlation alongside the rest of our monitoring metrics and events so we have full visibility into what is affecting their performance and availability in our Kubernetes cluster.
What makes Application monitoring hard in Kubernetes is the fact that the Pods (and hence containers) running the Application are dynamically scheduled on Nodes, meaning we can never know exactly what Application containers are running on each Node at any one time.
This requires our monitoring to support service discovery, which essentially means we configure our monitoring tool to use metadata and labels applied to a container to identify what application is running when it appears on a Node, and dynamically setup the configuration required to monitor that application at runtime.
For example, let’s assume we have a plugin that monitors two MySQL databases running in different Pods. To monitor MySQL you need to know the IP, the port, username and password at a minimum to connect to a MySQL instance and collect all its metrics. However, in this case both databases are running with different configuration settings. How do we know how to monitor each MySQL database with our plugin?
In our case, we are using the same MySQL container image, but have applied different labels to each container to identify them in the cluster: database:users and database:orders. This would be setup in our deployment configuration file to spin up the Pod to run them on Kubernetes and applied to the containers at runtime. We would then use these labels to identify which database is running in that container and then apply the pre-defined configuration to monitor them.
Summary
We have covered what Kubernetes is, why it’s hard to monitor, and all the core concepts and system architecture required to understand what’s actually running inside our Kubernetes cluster and what we need to get full visibility across the cluster with our monitoring.
In our next blog we will look at how to build Kubernetes monitoring using open-source tools such as Heapster and Prometheus, and then look at how Kubernetes monitoring can be done using Outlyer. In our final blog we will look into all the key metrics and events you get from Kubernetes and what they mean to help troubleshoot issues in your cluster.
Kubernetes Blog Series
- Part 1 Getting Started with Kubernetes Monitoring
- Part 2 Collecting Kubernetes Metrics with Heapster & Prometheus
- Part 3 How to Monitor Kubernetes with Outlyer
- Part 4 Key Kubernetes Metrics to Monitor
Interested in trying Outlyer for monitoring Kubernetes? We offer a 14-Day Free Trial – No credit card needed, get set up in minutes. Read The Docs to get started in minutes.