In the first post of this series (Monitoring Kubernetes) we covered:
- Why is it hard to monitor Kubernetes and applications running on top of it;
- Kubernetes main components;
- Which monitoring layers have to be covered by your monitoring solution.
This post covers where to find Kubernetes metrics and how to monitor it using two well-established open-source monitoring tools: Heapster and Prometheus.
Where to Get Kubernetes Metrics?
Every Kubernetes component exposes its own metrics in native Prometheus format as well as a convenient health check endpoint. These endpoints provide tons of metrics that can be scraped by monitoring tools for dashboarding and alerting. Let’s check where to find these endpoints for each Kubernetes component.
Etcd
In Kubernetes, etcd reliably stores all the configuration data of the Kubernetes cluster that represents the cluster state, which means it’s one of the most critical components of a Kubernetes cluster.
Health Check
Etcd exposes its health check endpoint at http://\<etcd-node>:2379/health. It returns OK if the quorum of nodes is up and running (for a cluster with n members, quorum is (n/2)+1).
Metrics
Etcd exposes its metrics endpoint at http://\<etcd-node>:2379/metrics.
$ curl http://<etcd-node>:2379/metrics
# HELP etcd_server_leader_changes_seen_total The number of leader changes seen.
# TYPE etcd_server_leader_changes_seen_total counter
etcd_server_leader_changes_seen_total 0
…
Later on this post, we will use this etcd metric (etcd_server_leader_changes_seen_total) as an example to show how to create graphs on Grafana and alerts using Prometheus.
API Server
The API Server is the main management point of the entire cluster. Even if the API Server is down, Kubernetes is still able run your containerized applications (one of the good lessons learned from Borg), however, it’s not able to schedule workloads or execute any management instruction.
Health Check
The API Server exposes its health check endpoint at https://\<api-server>:443/healthz. Note that \<api-server> is the Kubernetes Service name that exposes the API Server (the Kubernetes Service Discovery mechanism in action!).
Metrics
The API Server exposes its metrics endpoint at https://\<api-server>:443/metrics. Note that every request sent to the API Server goes through an authentication process. From within a container running in a Pod, you can curl the API Server providing the token:
$ curl -ik -H "Authorization: Bearer $(cat /var/run/secrets/kubernetes.io/serviceaccount/token)" https://api-server:443/metrics
# HELP apiserver_request_count Counter of apiserver requests broken out for each verb, API resource, client, and HTTP response contentType and code.
# TYPE apiserver_request_count counter
apiserver_request_count{client="Ruby",code="404",contentType="application/json",resource="replicationcontrollers",scope="namespace",subresource="",verb="GET"} 1
…
Controller Manager
The Controller Manager watches the state of the cluster through the API Server and makes the necessary changes attempting to move the cluster current state towards the desired state. If the Controller Manager is down, many functionalities such as rescheduling failed replicas and garbage collection are compromised.
Health Check
Controller Manager exposes its health check endpoint at http://\<controller-manager>:10252/healthz.
Metrics
Controller Manager exposes its metrics endpoint at http://\<controller-manager>:10252/metrics.
Scheduler
The Scheduler watches for unscheduled Pods and binds them to appropriate nodes according to the availability of the requested resources, quality of service requirements, affinity and anti-affinity specifications, and other constraints. If the Scheduler is down, Pods (new or failed ones) can’t be assigned to nodes.
Health Check
Scheduler exposes its health check endpoint at http://\<scheduler>:10251/healthz.
Metrics
Scheduler exposes its metrics endpoint at http://\<scheduler>:10251/metrics.
Kubelet / cAdvisor
The Kubelet is an agent that runs on each node and it’s one of the most important components in Kubernetes. Its main responsibilities include starting containers and reporting the status back to the API Server and running container probes. Also, it ships with an embedded cAdvisor instance which collects, aggregates, processes and exports metrics such as CPU, memory and network usage of the running containers.
Probes
Kubernetes provides two mechanisms to ensure that Pods are up and running: Readiness Probes and Liveness Probes. First, you set them up in your Pod definition and then the Kubelet runs the probes against the Pods.
When it comes to Readiness probe, Kubernetes will not send traffic to Pods until the probe is successful. For example, when running a Rolling Update, Kubernetes will only route traffic to new Pods if they are ready.
Liveness probes, on the other hand, restarts the Pod if the probe fails. Hopefully, after the restart, the Pod will work properly again and Kubernetes can start routing traffic to the Pod.
Health Check
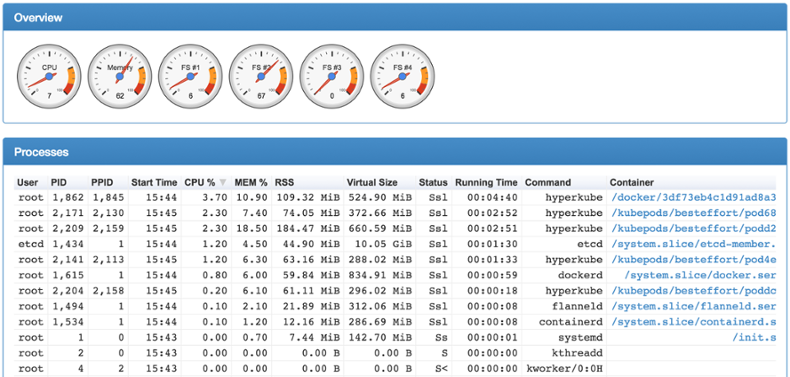
The Kubelet exposes its health check endpoint at http://\<node>:10255/healthz. It’s also possible to reach it through its secure port 10250: https://\<node>:10250/healthz (the same is valid for the metrics endpoint). cAdvisor, on the other hand, runs on port 4194 and its health check is available at http://\<node>:9194/healthz. cAdvisor also ships with a simple built-in web interface:
Metrics
Kubelet exposes cAdvisor metrics at http://\<node>:10255/cadvisor/metrics and its own metrics at http://\<node>:10255/metrics. In addition, the Kubelet also provides the Summary API at http://\<node>:10255/stats/summary, which aggregates the node and Pods metrics for components like Heapster to consume.
kube-state-metrics
The kube-state-metrics is a simple add-on service that listens to the API Server and generates metrics about the state of the Kubernetes objects such as Deployments, Nodes and Pods. It is deployed as part of your cluster as a regular Deployment and Service and typically exposes Kubernetes metrics on port 8080 and its own metrics on port 8081.
Health Check
kube-state-metrics exposes its health check endpoint at http://\<kube-state-metrics>:8080/healthz.
Metrics
kube-state-metrics exposes Kubernetes objects metrics at http://\<kube-state-metrics>:8080/metrics and its own metrics at http://\<kube-state-metrics>:8081/metrics.
Interested in trying Outlyer for monitoring Kubernetes? We offer a 14-Day Free Trial – No credit card needed, get set up in minutes. Read The Docs to get started in minutes.
Monitoring Kubernetes using Heapster
Heapster fetches metrics (such as CPU and memory utilization) from the API Server and Kubelets (Kubelet Summary API), aggregates and transforms them to cluster-wide metrics, and sends them to various time-series backends such as InfluxDB. Note that while Heapster’s focus is on forwarding and exposing metrics already generated by Kubernetes, kube-state-metrics is focused on generating completely new metrics.
In addition, Heapster metrics are available for the past 15 minutes through a REST API which is consumed by the Kubernetes Web UI add-on (Kubernetes dashboard) and by the kubectl top node and kubectl top pod commands.
Note: In the future, this REST API will be replaced by the Kubernetes metrics APIs in k8s.io/metrics.
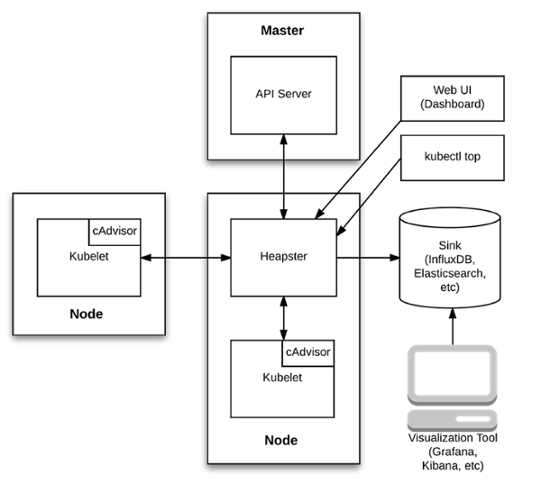
Once Heapster and the Kubernetes Web UI are deployed in the cluster, the Web UI is able to show many graphs that are useful for monitoring and troubleshooting (it does not offer alerting capabilities). For example, the dashboard below shows the short-term total CPU and memory usage metrics for a single-node Kubernetes cluster created with Minikube:
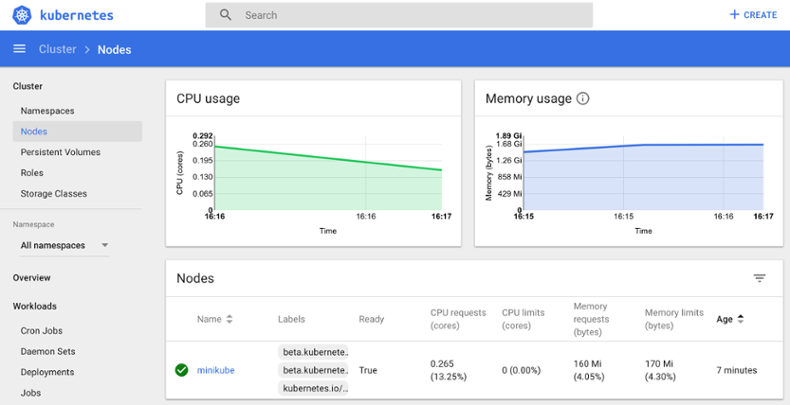
The left-menu shows the various out-of-the-box dashboards you can visualize with Kubernetes Web UI as well as filtering them by Namespace.
Long-term metrics can be visualized on Grafana. Below is the same CPU and memory usage per node dashboard shown on Grafana:
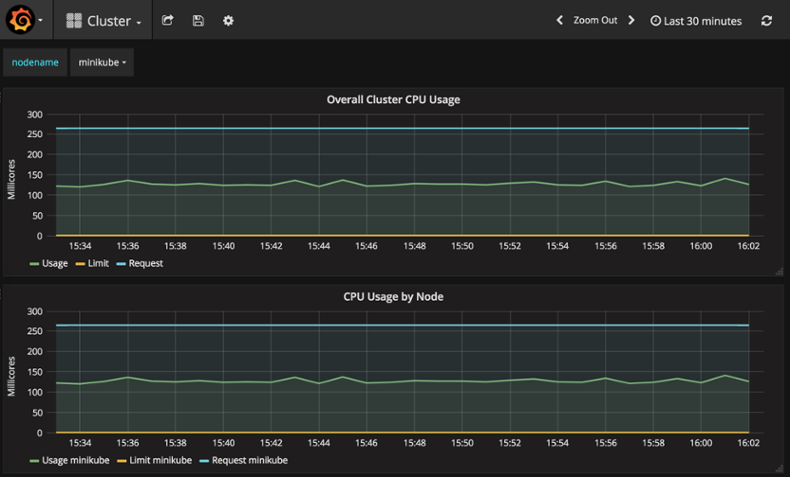
Note: when it comes to Heapster, both Kubernetes Web UI and Grafana uses only Heapster metrics rather than the Kubernetes endpoints mentioned earlier.
Grafana enables you to choose the time range on the top-right menu. For each graph, it’s also possible to set up alerting rules that would trigger an alert if a defined threshold is crossed (for example, the cluster CPU usage greater than 200 Millicores). It’s also possible to create custom graphs based on Heapster metrics stored in a sink (typically InfluxDB).
Heapster only allows you to monitor the Infrastructure and Kubernetes monitoring layers. Your own applications and services (like Nginx, RabbitMQ, etc) cannot be covered by Heapster.
Note: Heapster currently also enables the use of the Horizontal Pod Autoscaler to automatically scale the number of Pods in a Replication Controller, Deployment or Replica Set based on observed CPU utilization or custom application metrics.
Kubernetes Monitoring using Prometheus
Prometheus is an open-source pull-based systems monitoring and alerting tool that allows to monitor not only the infrastructure and Kubernetes itself (like Heapster), but also the Service and Application monitoring layers.
Prometheus scrapes metrics from various targets (for example, the Kubernetes endpoints presented earlier) on a predefined time interval, stores them into a local on-disk time-series database and let you do useful things with them like querying with PromQL, alerting with Alertmanager and creating custom dashboards in Grafana (which provides a native Prometheus data source).
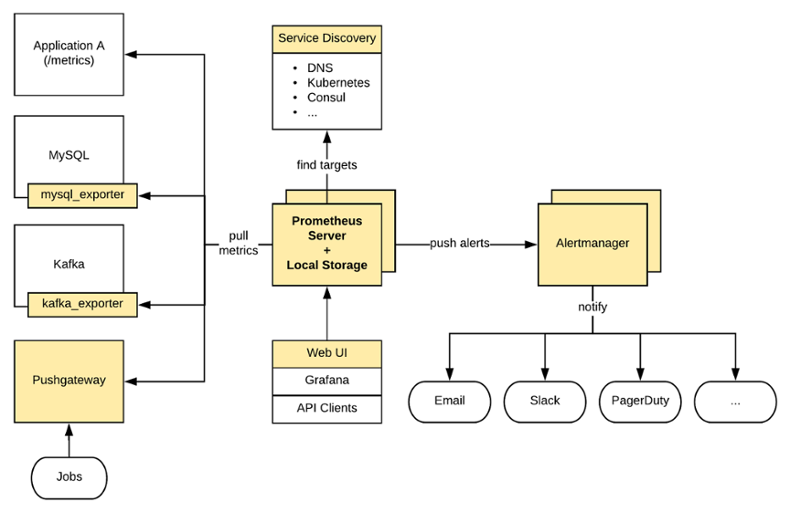
An application can expose its metrics in Prometheus format using a Prometheus Client Library. For other services that don’t expose metrics in Prometheus format (like your Linux servers, MySQL, RabbitMQ, etc), Prometheus exporters can be used.
Prometheus was especially designed to run on dynamic environments like Kubernetes as it can easily integrate with the Kubernetes Service Discovery mechanism. It can automatically discover all Endpoints of a Service by simply adding the Annotation prometheus.io/scrape: 'true' to a Service definition (just like the kube-state-metrics Service definition).
A Prometheus configuration file for Kubernetes should contain global configurations (scrape_interval, scrape_interval, etc), Kubernetes Service Discovery configuration, targets configuration (the Kubernetes endpoints presented earlier plus application metrics endpoints and exporters) as well as including alerting rules.
Below is an alert rule example configuration against the metric etcd_server_leader_changes_seen_total scraped from the etcd /metrics endpoint, which triggers an alert if there is more than 3 leader changes within an hour:
- alert: HighNumberOfLeaderChanges
  expr: increase(etcd_server_leader_changes_seen_total{job="etcd"}[1h]) > 3
  labels:
    severity: warning
  annotations:
    description: etcd instance has seen leader changes within the last hour
    summary: a high number of leader changes within the etcd cluster are happening
Once a Grafana instance is deployed on your cluster and configured with the Prometheus data source, you can create dashboards and graphs based on the scraped metrics. Below is a graph based on the same etcd metric that shows the total etcd leader elections per day, configured with the following PromQL expression: changes(etcd_server_leader_changes_seen_total[1d])
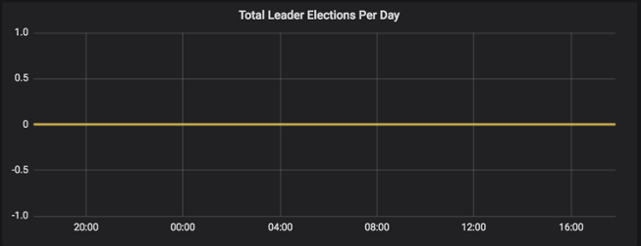
Using the same approach you can create alerts and dashboards for the most important metrics to ensure your Kubernetes cluster is working well. Part 4 of this Monitoring Kubernetes blog post series will approach what are these key metrics.
In the next post, you are going to learn how to monitor Kubernetes using Outlyer, which provides full monitoring capabilities, automated integrations with the most commonly used services, out-of-the-box dashboards and also takes advantage of Prometheus power by being able to easily scrape metrics on native Prometheus format.
Kubernetes Blog Series
- Part 1 Getting Started with Kubernetes Monitoring
- Part 2 Collecting Kubernetes Metrics with Heapster & Prometheus
- Part 3 How to Monitor Kubernetes with Outlyer
- Part 4 Key Kubernetes Metrics to Monitor
Interested in trying Outlyer for monitoring Kubernetes? We offer a 14-Day Free Trial – No credit card needed, get set up in minutes. Read The Docs to get started in minutes.