In the old world before cloud and continuous delivery you used to set stuff up once and then leave it alone until the monitoring system notified you of a problem.
Nowadays things move more quickly. You need to manage change quickly and safely across a large number of servers which explains why tools like Ansible have become extremely popular.
Releasing small incremental changes to your service and then needing to frequently tweak the monitoring is part of the daily routine. It’s the same overhead developers have when software changes and the tests need to be fixed.
In an ideal world everything would happen automatically but the reality is that humans are still required to get involved. Our philosophy has always been to concentrate on making it very fast to make changes and then to automate what can be done by a computer to save time.
So when we think about ways to speed up getting information, and automating that process, we can draw upon what has proven to work for many years : the command line. Even the Windows world has been moving to Powershell over the past few years because the command line is simply better at some tasks than a GUI.
With this in mind we built our own command line tool for Outlyer to hopefully help speed up the process of answering questions.
You should be able to type a command and find out what alerts are open, which servers are up and down, what the last few metrics on a server are. Or even just quickly verify what’s in a plugin and ensure things are setup as expected. Developing a plugin locally and quickly testing it works on some remote test servers with a single command should be quick and easy.
Well now you can do all of those things..
Announcing DLCLI
We have a new command line tool that is supposed to help speed up troubleshooting and automating tasks that use our API. Outlyer is a real-time monitoring system so we can get instant answers back from agents directly over the websocket.
To get started you need to install dlcli on your OSX or Linux machine. It’s designed to be a tool that sysadmins can run on their personal computer but can also be used on servers when automating things.
pip install dlcli
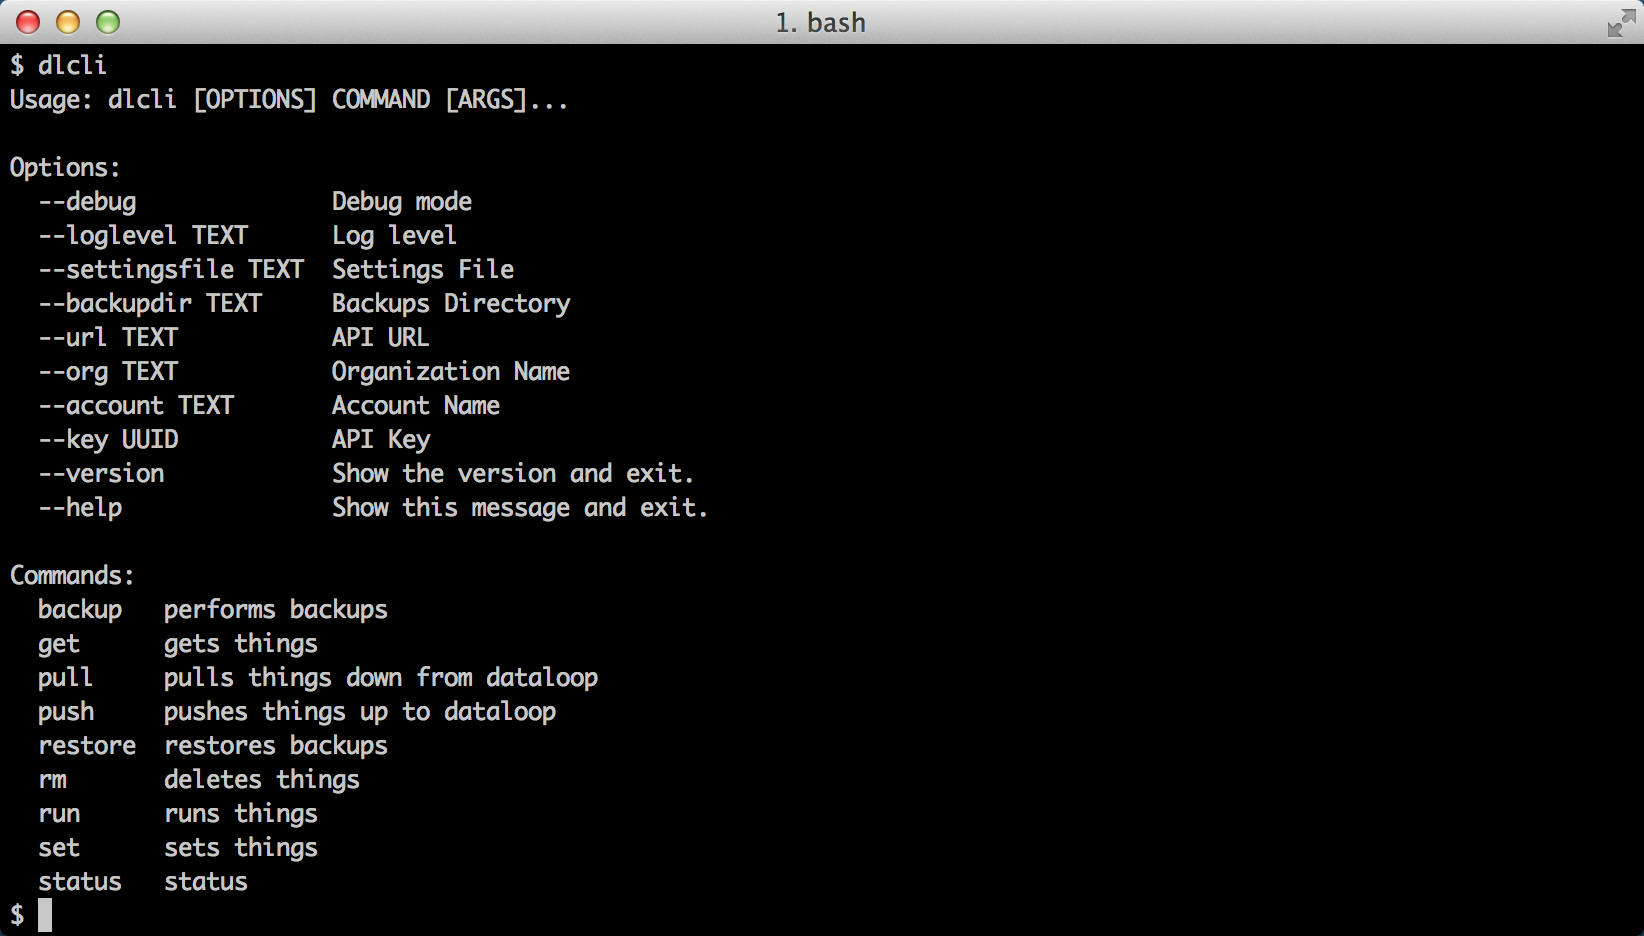
Once you have dlcli installed you can see a list of commands by simply typing dlcli.

Typing dlcli followed by the command you want to know more about will provide additional help.
To get dlcli running you’ll need to tell it some details about your Outlyer account. You can do this in a couple of ways but the simplest is to create a file in your home directory called dlcli.yaml with the following details:
---
url: https://app.outlyer.com/api/v1
org: acme-ltd
account: staging
key: xxxxxxxx-xxxx-xxxx-xxxx-xxxxxxxxxxxx
You shouldn’t need to change the url but you’ll need to update the org, account and key to match your Outlyer details.
When you’ve done that you can run dlcli status and it will tell you if you are authenticated or not. If you have multiple accounts you can create multiple files and pass the yaml file in using the –settingsfile option. Or, you can use the dlci set command to set these options interactively or within scripts.
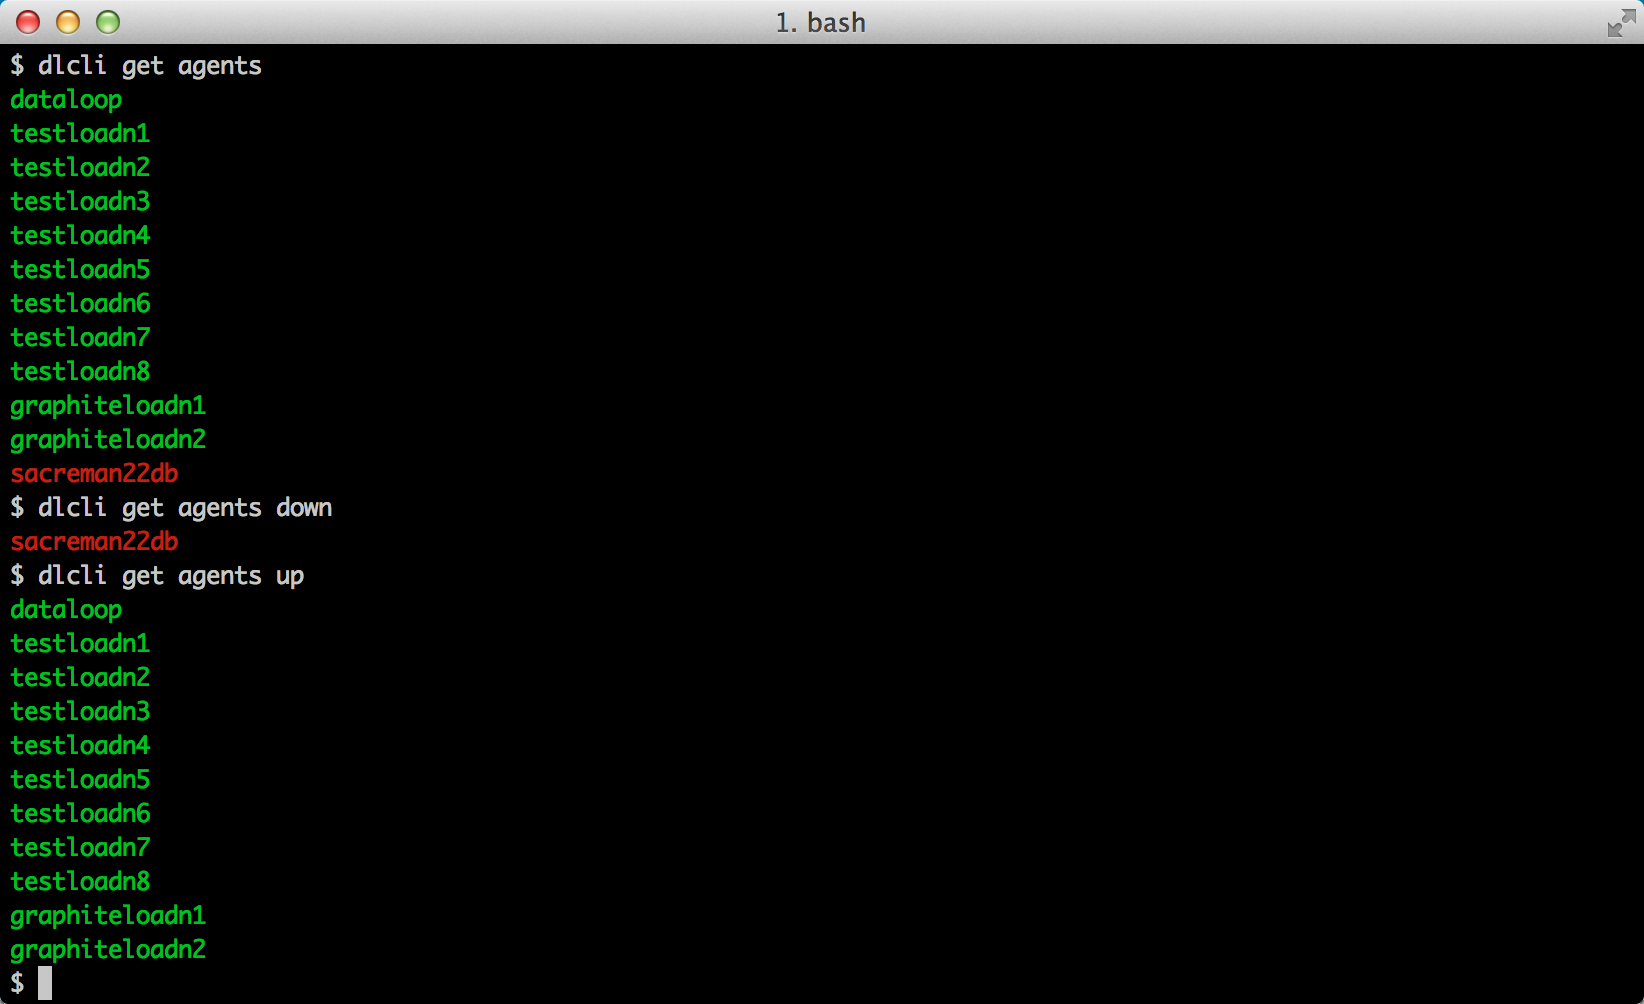
Now onto the cool stuff! Finding out what agents you have and which ones are up and down.

Some one pulled the plugin on a Riak server. Now when you get back to your desk instead of orienting yourself with several dashboards or alert emails you can simply ask what agents are down and what alerts are currently triggered. Knowing the answers to those questions helps calm the panic.

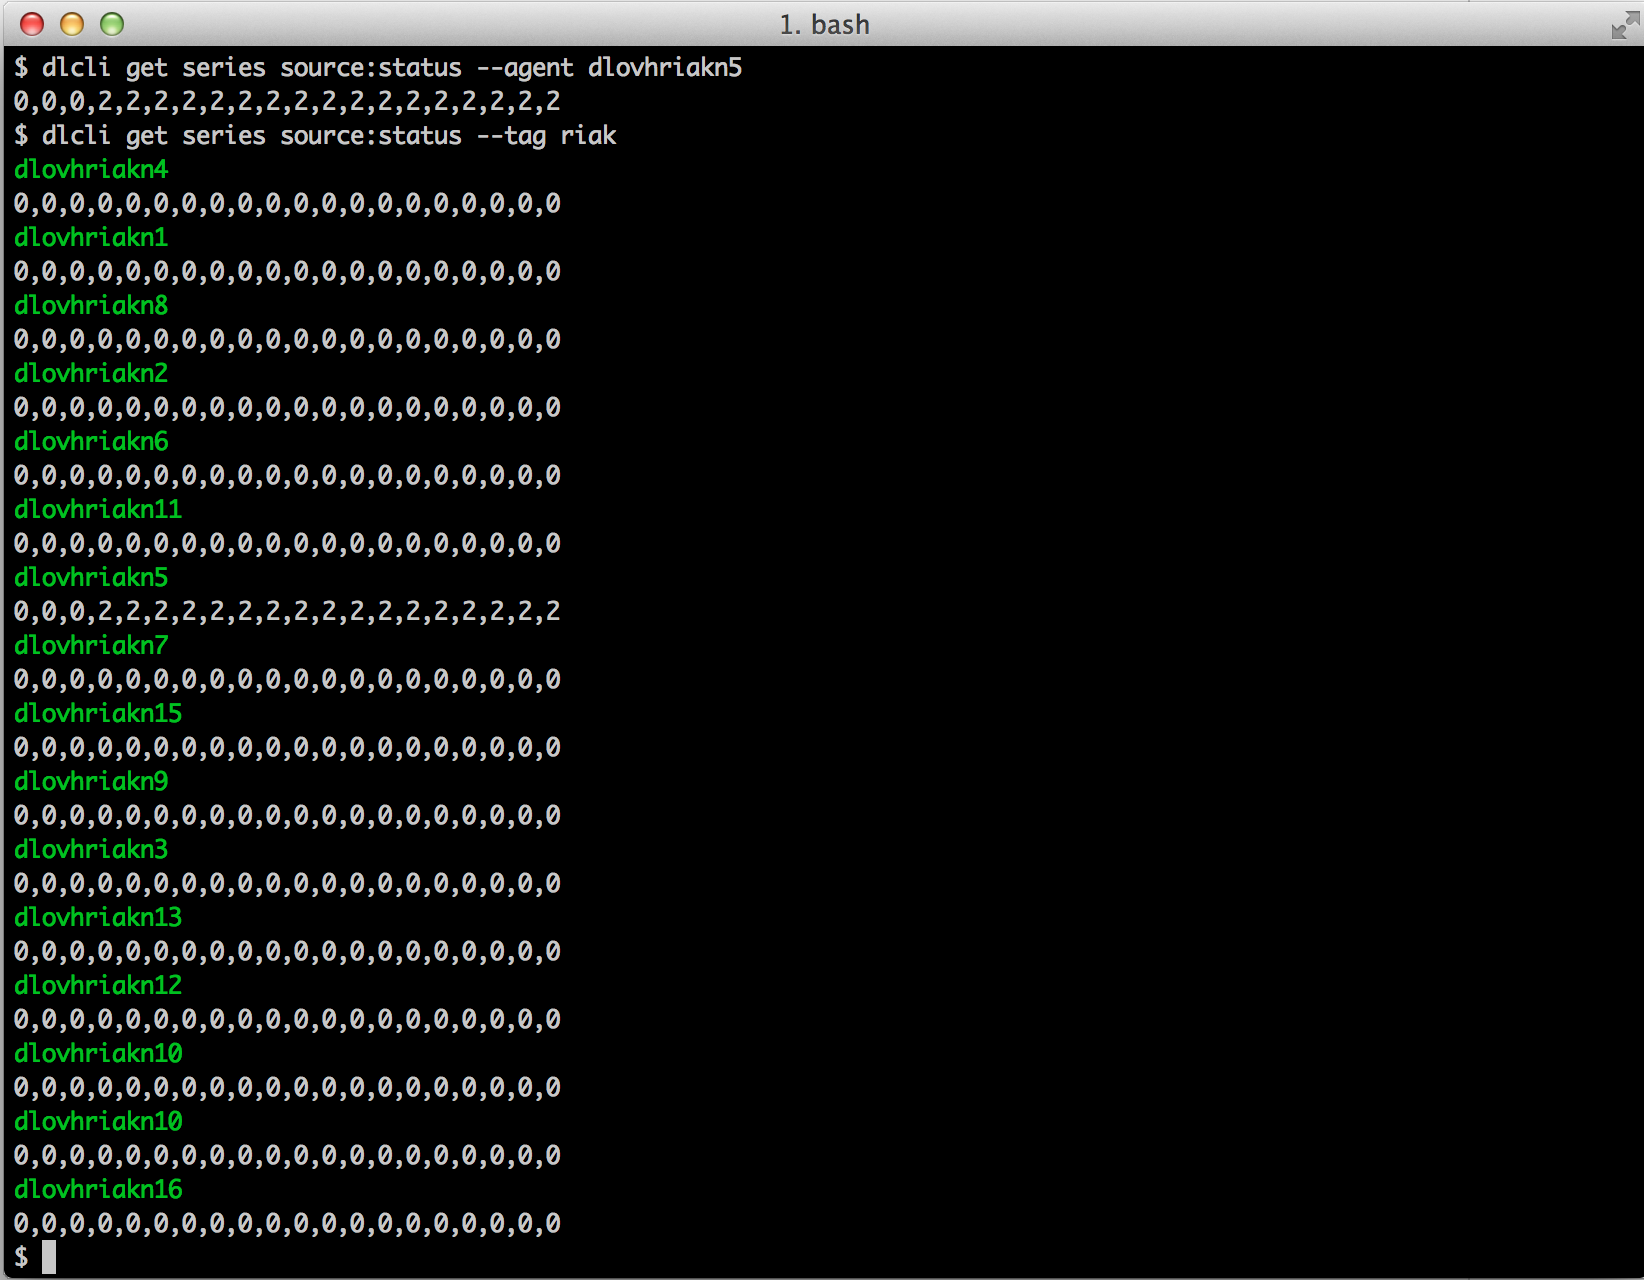
That’s a bit of a relief. It’s just that one box causing the production-riak rule to alert. I wonder how long it has been down for and if any of the other Riak nodes have had a wobble.

By default, get series displays the last 10 minutes of data for a metric path at 30 second resolution. So we can see that the box has been down for about 8 minutes and none of the others have had any blips in that time.
You can do a lot more with dlcli including uploading dashboards, plugins and rules from yaml files. You can run plugins remotely and get the output which is pretty cool for using in orchestration tasks when the next step of a process depends on verification that some other service is up and working. You can also fully backup and restore all of your Outlyer config to human readable yaml.
If you want to read more about the awesome backup and restore from command line that’s discussed here:
/blog/monitoring-configuration-files-vs-databases/
I encourage you to give it a try and provide some feedback. We’ll continue iterating on dlcli and have some ideas for displaying dashboards and graphs on the command line in future.