Docker was like teenage sex, everyone talked about it but hardly anyone was actually doing it, at least in production anyway. However in the last 12 months, it appears there’s been a tectonic shift towards Docker, and more and more of our customers have started putting significant production workloads onto Docker.
In addition, more and more of our new users were coming to us specifically for Docker monitoring because frankly, the legacy tools can’t do it very well. Docker monitoring requires a fundamental change in the way your agents, plugins and monitoring platform work to support containers.
We also had a lot of feedback that while there are a lot of new solutions out there, there was a high setup cost to really get them working across complex environments. This is because they were either more traditional server monitoring products that had bolted Docker monitoring on, or they were newer Docker specific monitoring tools that only worked in the land of Docker, resulting in yet another monitoring tool to look at.
We’ve had a Docker monitoring solution since 2015 using cAdvisor, but it definitely was a bolt on to our core product. So we took a step back and decided to completely redesign our Docker monitoring capabilities from the ground up.
It turned out that our unique remote configuration technology and auto-discovery integrations, meant we were able to deliver a Docker monitoring solution that can literally be setup in minutes, even on complex Docker environments, and today I’m excited to announce that it’s ready for mainstream use!

How it Works
We completely re-engineered our monitoring agent and plugin model to support containers natively (see a talk on how we built it here).
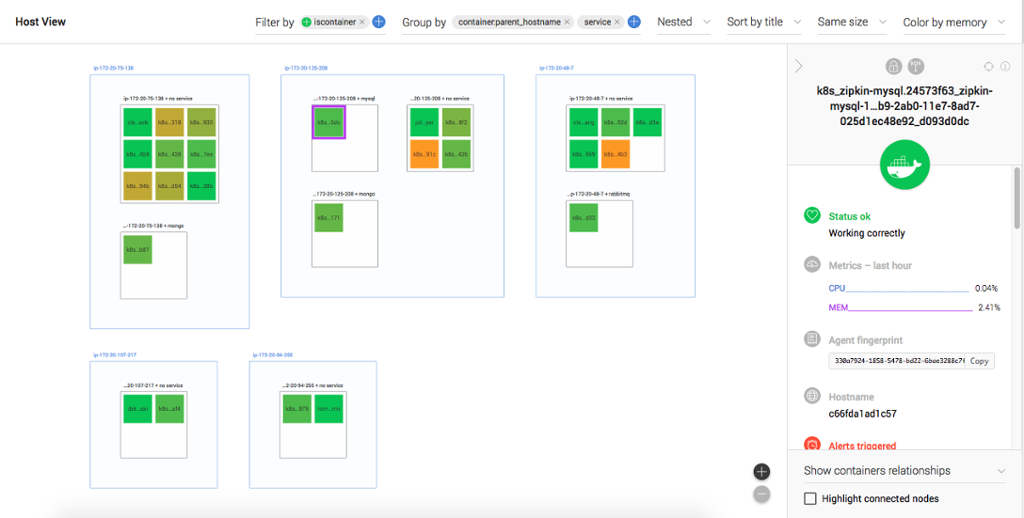
By deploying an agent per host, either directly on the host itself, or using our container image, it will immediately discover all your containers on the host. Any labels on the container will automatically be applied to the container properties in Outlyer, so you can view, filter and group your containers by labels using our new host map view:

In the above example I’m running a simple eCommerce application with several services deployed on Kubernetes. By using filters and group by operations on all the discovered labels, I can easily get a view of what’s running in my environment and organize them into a logical view of hosts, services and pods in a couple of clicks to see where everything is running.
You can also add your own custom labels when you deploy containers to add other dimensions to filter and group on. And all these labels can also be used to deploy integrations and custom plugins in minutes using our auto-discovery and unique remote configuration technology.
Simplest Setup
One of the biggest challenges we’ve seen with other solutions out there, is that they’re quite hard to setup across complex environments, especially if you want it to be a self-service solution that can be rolled out across multiple teams. A lot of companies we meet have had to build a lot of bespoke tooling around these solutions to get to a point where it’s easy for them to roll out new monitoring across their teams.
We wanted Outlyer to be super simple and fast to setup—instant gratification. You should be able to go from deploying our agent to seeing all your Dockerized services monitored in minutes, even in a complex environment.
We already have built in auto-discovery for our server monitoring, and a unique centralized configuration model that allows Outlyer to setup everything for the user, and allow changes by the user to be quickly rolled out in seconds across 1,000’s of servers using labels.
Outlyer’s monitoring deployment is a simple as labeling a container when it’s started (using Docker compose files or Kubernetes, Swarm or Mesos) and plugins will automatically run against them. With our auto-discovery service, our integrations can automatically recognize common services like Nginx or MySQL, and automatically install the integrations and start running them against the containers with those services.
For example if I had a container service called ‘billing’ in ‘production’ and wanted to run a plugin against it, I would configure the plugin to run against anything with the container image ID ‘billing’ with the label ‘environment=production’ applied. In the UI the user just selects the combination of labels they want to run against, and the agent magically does the rest of the work to start monitoring the service immediately.
Customization
If you have anymore more complex than a handful of servers, inevitably you will need to customize and extend your monitoring to run custom integration plugins for bespoke service checks specific to your environment.
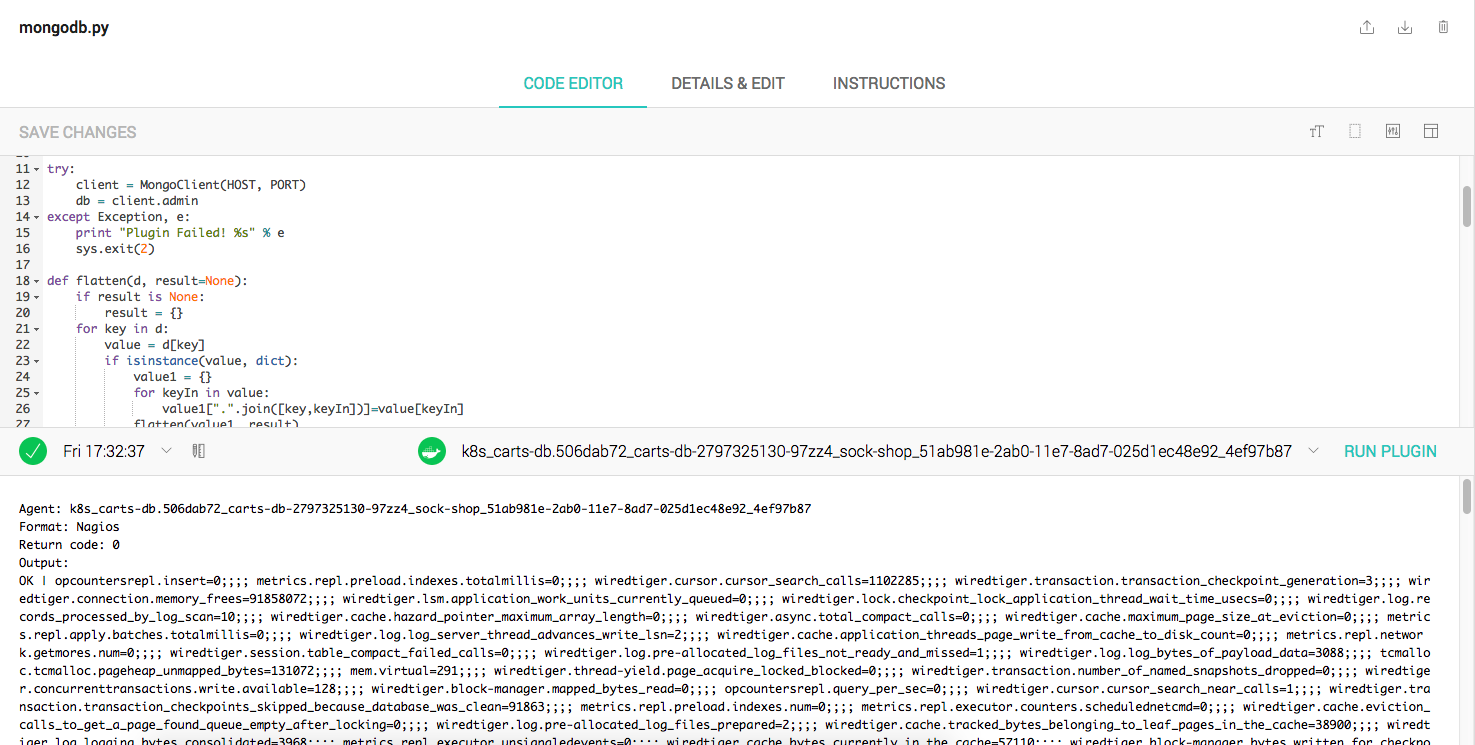
This is where Outlyer shines. Using our unique deployment model described above, you can actually use our built in plugin IDE to create and test new custom plugins that can be deployed at scale in seconds.

Imagine you discover a gap in your monitoring after an incident. Your monitoring wasn’t checking the number of database connections a Java service was using, and ran out of connections. Simply write a plugin in our IDE using our JMX bridge to pull that count out of the Java service running in the container service that failed, and roll it out. You could even do it mid-incident to fetch more data about what’s going on in real time if the metrics you have at your disposal aren’t getting you the answers you need!
As I spoke about last year, it’s all about getting you from the idea of what you need to monitor, to seeing that on a graph or alert as quickly as possible - no other monitoring tool can do it that fast today.
Also, our plugins will work against containerized and non-containerized services transparently. Our agent hides the implementation details so you can just write your plugins once and deploy anywhere!
Collecting Application Service Metrics
Your developers probably want to instrument their services using Prometheus exporters or StatsD to expose or push metrics to the monitoring tool, so their metrics can be correlated alongside infrastructure metrics.
Our agent has built in StatsD support that other containers can connect via to push metrics to Outlyer using StatsD, and a built in Prometheus scraper that can scrape Prometheus endpoints to collect dimensional metrics from your application services.
A Single Platform for Container and Host Monitoring
Because our unique deployment technology is already how we do host (server) monitoring for non-container environments, and our plugins run transparently on both container and non-container services, we’ve been able to provide a consistent configuration experience across your entire environment. Really powerful when you want to make monitoring self-service for your teams and don’t want to roll out complex training to help them get up and running.
It also means you don’t need to have yet another tool in your monitoring stack, Outlyer will monitor your entire environment providing you a true single pane of glass view across everything, and a single platform your teams can use to collaborate around to deliver a better service for your users.
Summary
As you can see, we’ve put a lot of thought and effort into making it super fast and simple to setup Docker monitoring across even the most complex environments using Outlyer. No need to edit huge YAML configuration files everywhere or configure exporters across all your services, just install our agent and let it do all the work for you dynamically.
Spend less time setting up your monitoring, and more time using the metrics, dashboards and alerts to understand what’s going on in your environment, and ultimately build a better service for your users!
If you want to try it for yourself, you can sign up and see it in action fully setup and running in minutes!