As of this week all accounts will get provisioned with their own ‘outlyer’ docker container!
Traditionally we have only provided internal monitoring. You can install an agent or configure third party tools to send data into our Graphite port. Metrics collection has always been performed by servers that customers run. Our SaaS platform is really just an open standards compliant backend to the same collection you would typically setup if you had Nagios or Graphite on-premise. We provide a very slick UI that helps non-ops people setup collection, dashboards and alerts, as well as take care of all of the scaling issues. Problems that present themselves as SaaS companies start to scale up.
The new docker containers are the first time where we perform the collection on our servers. I guess this now also makes Outlyer the first monitoring focussed PaaS :D
While working with our current customers we have often suggested they setup a central polling server running a Outlyer agent that collects metrics from remote systems where installing an agent isn’t possible. When those metrics come from servers behind the firewall like self hosted Jenkins or Jira this will still be the case. However, there are a whole bunch of scenarios where having an external agent makes a lot of sense.
Uses for the Outlyer container
The docker container does two things:
-
You can use it to run Nagios check scripts on Outlyer infrastructure
-
It runs a StatsD server so you can connect StatsD clients directly to it
Nagios Scripts
We are the only monitoring tool that lets you write custom plugins in the browser, test and then deploy them directly to agents. So providing a safe, containerised docker environment to test out those features instantly was one of our goals. We also wanted to provide a quick way for people to check their internet facing endpoints and scrape their 3rd party services (e.g. Google Analytics, Splunk, New Relic or even Twitter). Stuff like Pingdom is cool for checking latency from around the world but they don’t give you the ability to run proper check scripts.
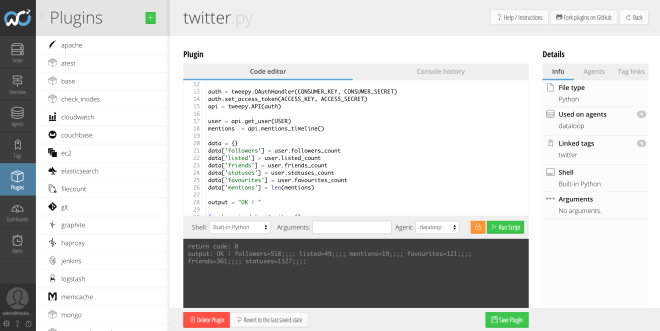
Here’s an example of a quick twitter script I created running in a new Outlyer docker container.

For the first iteration of the docker container we’re focusing support on our ‘built-in python’ shell. This means you can write scripts in any language as long as that language is Python :) We will add more languages to the container in future releases.
What does the ‘built-in python’ shell give you? Quite a lot actually. We bundle an embedded Python 2.7 runtime and lots of libraries for you to use to create your own plugins. So you get the full power of the Python standard library, as well as libraries that let you scrape api’s (requests, beautiful soup, xmltodict) or even test websites with robobrowser. There’s quite a lot in there and we’re happy to add more. To see exactly what is available we list all of the libraries here:
https://support.outlyer.com/hc/en-gb/articles/205618375-Built-In-Python
We’ve already written quite a few plugins that you can try:
https://github.com/outlyerapp/plugins
You could set all of this up before the docker container by using a local agent on your own server but now you can get from signup to sending in data from all over the place in a few minutes.
Signup, have a play around and if you end up creating an awesome script and dashboard please feel free to submit a pull request back to our Github plugin and dashboards repo so other people can try them.
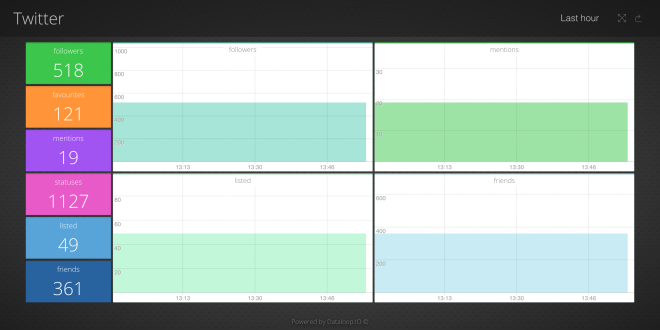
Here’s a quick dashboard I did for our Twitter the other day.

We need a bit more social activity to make the graphs look cooler. The fact that we have twitter data in the app now sitting alongside dev and ops metrics, as well as data from a range of other places means you can create dashboards and alerts that are useful for a wide variety of teams. You might even want everything together on one summary dashboard.
If you are interested in what sort of dashboards you should be creating we did a blog that touches on that subject here:
/blog/using-monitoring-dashboards-to-change-behaviour/
I’m also talking at Operability.IO in September about this. Hopefully with a few more examples of how SaaS companies are using data to improve their businesses.
Hosted StatsD
Developers love StatsD metrics. They are probably the single greatest tool a developer could ever use for monitoring their app. Extremely quick to setup and immensely powerful. You can get production to emit non blocking UDP packets containing metrics about any piece of live data you wish. From timing functions and classes to tracking shopping basket contents, or even how many times a feature was used.
Until now customers were expected to setup their own StatsD servers. This is still a supported option, however, you can now get from signup to accepting StatsD metrics in minutes without any additional servers setup. For developers with a strict time budget hopefully this will help out.
Some details on how you get up and running with that are here:
https://support.outlyer.com/hc/en-gb/articles/204924459-Hosted-StatsD
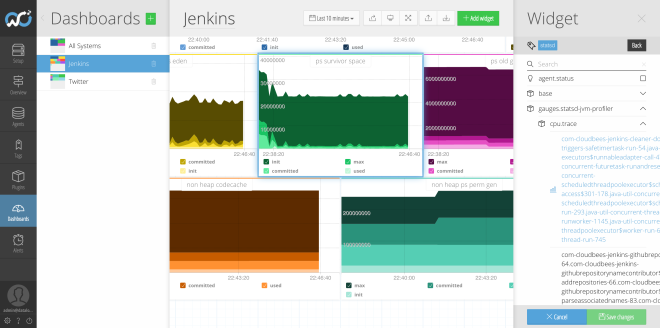
I’ve already had a bit of fun profiling our Jenkins JVM. With the addition of a javaagent option to the Jenkins startup command in the init script and a service restart I now get all of the memory and cpu profiling directly into my docker statsd port.

Not bad for less than 1 minute of time invested to setup.
Request for feedback
The docker container is a new feature and as such we’re always very interested in feedback. Is it a crazy idea? Could it be made even better? Ping us an email with any suggestions you might have.