At the beginning of August, we embarked on two huge projects: an in-depth AWS integration, and the first stage of our analytics features. Some customers have been beta testing these for a couple of weeks. We’ll do some specific blog posts next week when they go GA.
Metrics Browser
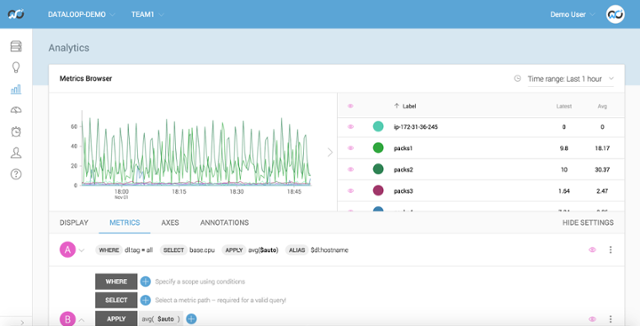
The metrics browser unleashes the full power of the DalmatinerDB query language inside Outlyer. You can construct SQL style queries across your Nagios, Graphite, StatsD, InfluxDB, Prometheus and AWS CloudWatch metrics.
The query editor component of the metrics browser will soon be available in the dashboards and alerts sections of Outlyer. Expect to see another top level page in the left navigation bar in the next few days.
AWS Integration
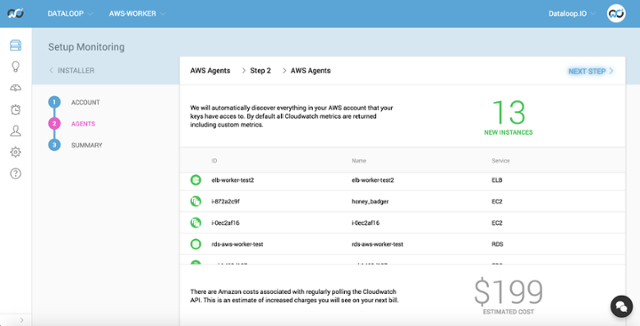
With our AWS integration, you can now simply enter an API key and secret, and we’ll automatically discover all of your resources. We’re putting the finishing touches to the dashboards and alert rules in our packs.
If you’d like to enable this integration immediately, get in touch with @tomash in the Outlyer support Slack.
InfluxDB Metrics
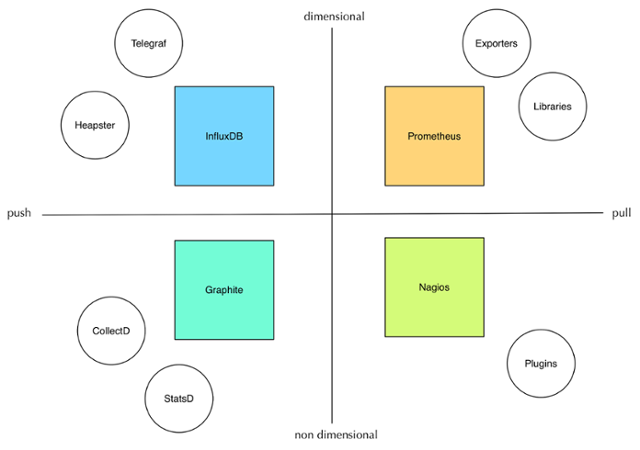
As discussed in a previous blog post, we now have support for InfluxDB metrics. This means that, if you’re currently using Telegraf as a metrics collector, you can point it directly at Outlyer. Similarly, anything with an InfluxDB output can be pointed at Outlyer, for example Heapster which collects container metrics from Kubernetes clusters.
Mute and Unmute
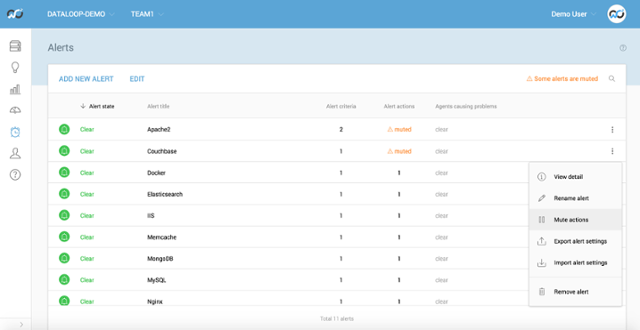
You can now mute and unmute rules both in the UI as well as our command line utility and API.
Enhanced Plugin Import
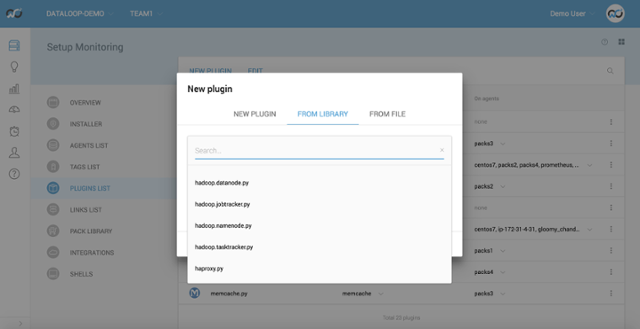
In the past you needed to open GitHub and copy and paste from our plugin library into Outlyer. Now you can import plugins directly.