We’ve been pretty busy since the beginning of the year adding lots of new features. This blog is a round up of the new things in case you missed the updates in Slack.
Multi User Account Model
This is the head-liner for Q1 and it’s 99% complete with multiple accounts released at the end of January, multi users added at the end of February along with user roles and last week we added per user API key management.
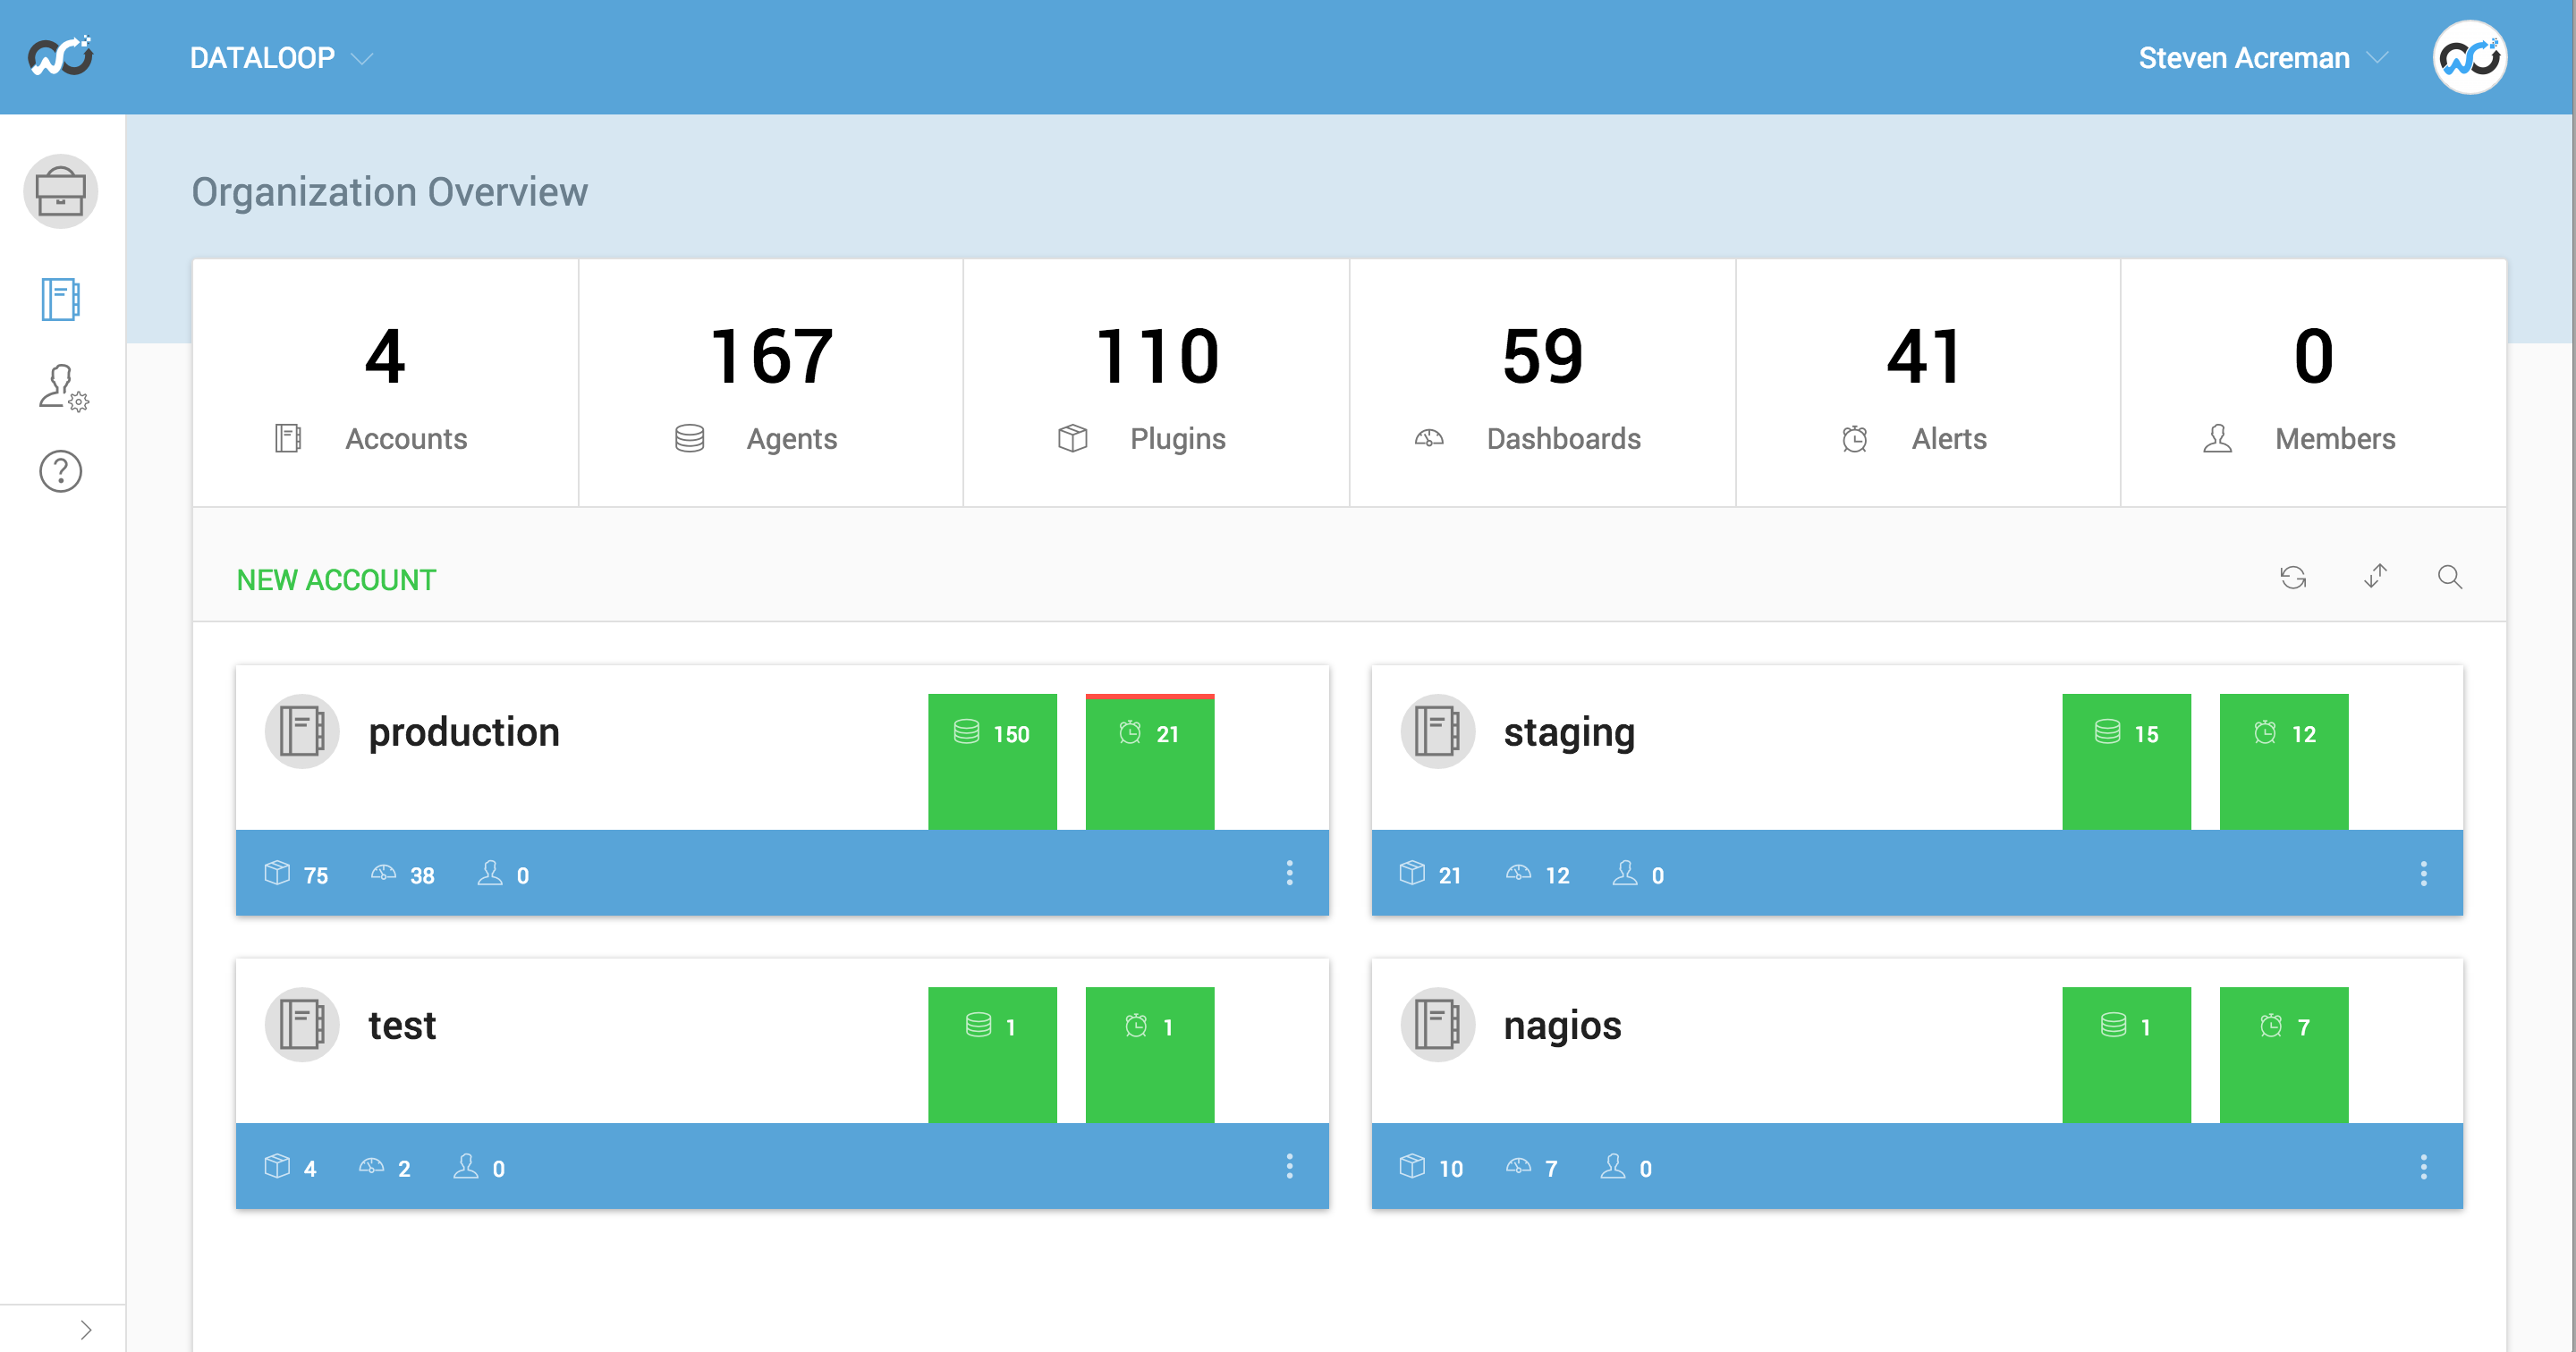
We plan to add a new member role called ‘view only’ next. Today you can quickly carve up your monitoring into accounts that match your organisation, invite users in, and fine tune what they can access.
More details can be found here:
https://support.outlyer.com/hc/en-gb/articles/207937576-Overview
Grafana Integration
We’ve been working quite hard on our new time series database. The first feature this adds for customers is the ability to use the Grafana dashboard for StatsD metrics.
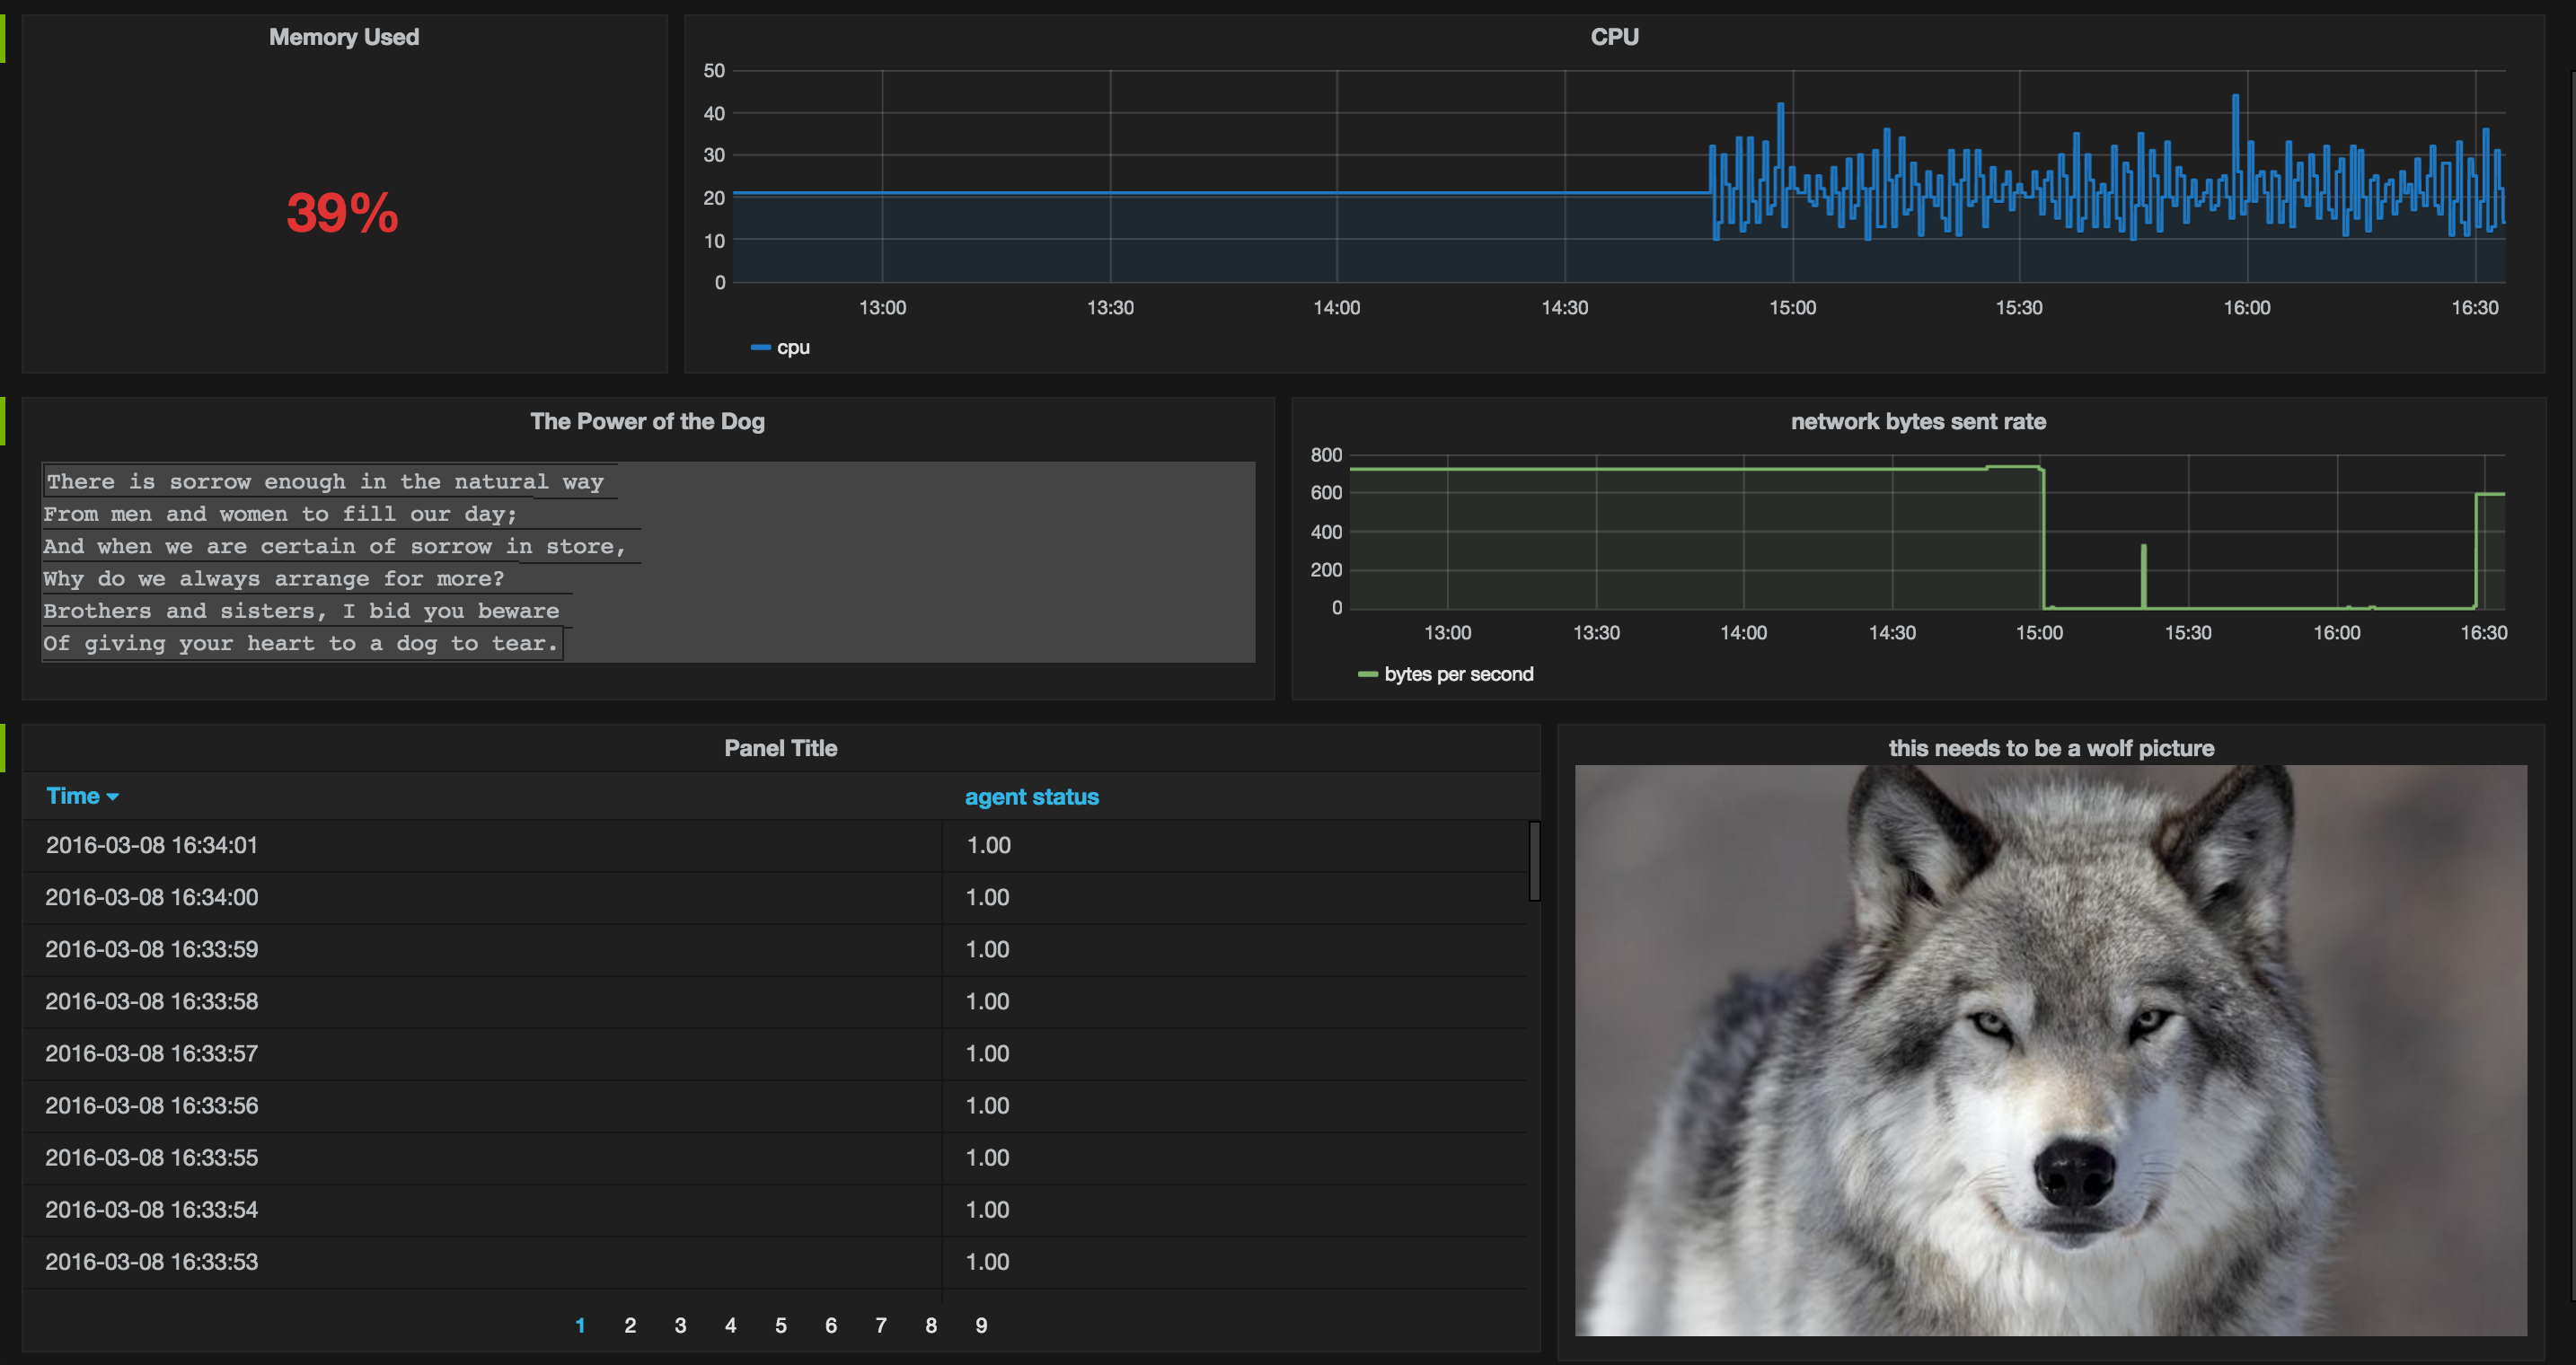
This is just the first of many new features that we’ll be unlocking over the next few months. You can read about why you might want to use Grafana here:
/blog/statsd-outlyer-and-grafana/
You can find out how to set up Grafana here:
https://support.outlyer.com/hc/en-gb/articles/208388113-Grafana
New Widgets!
We added another couple of widgets to our dashboards to help visualise data. These are the Scatter Plot and the Stacked Bar widgets.
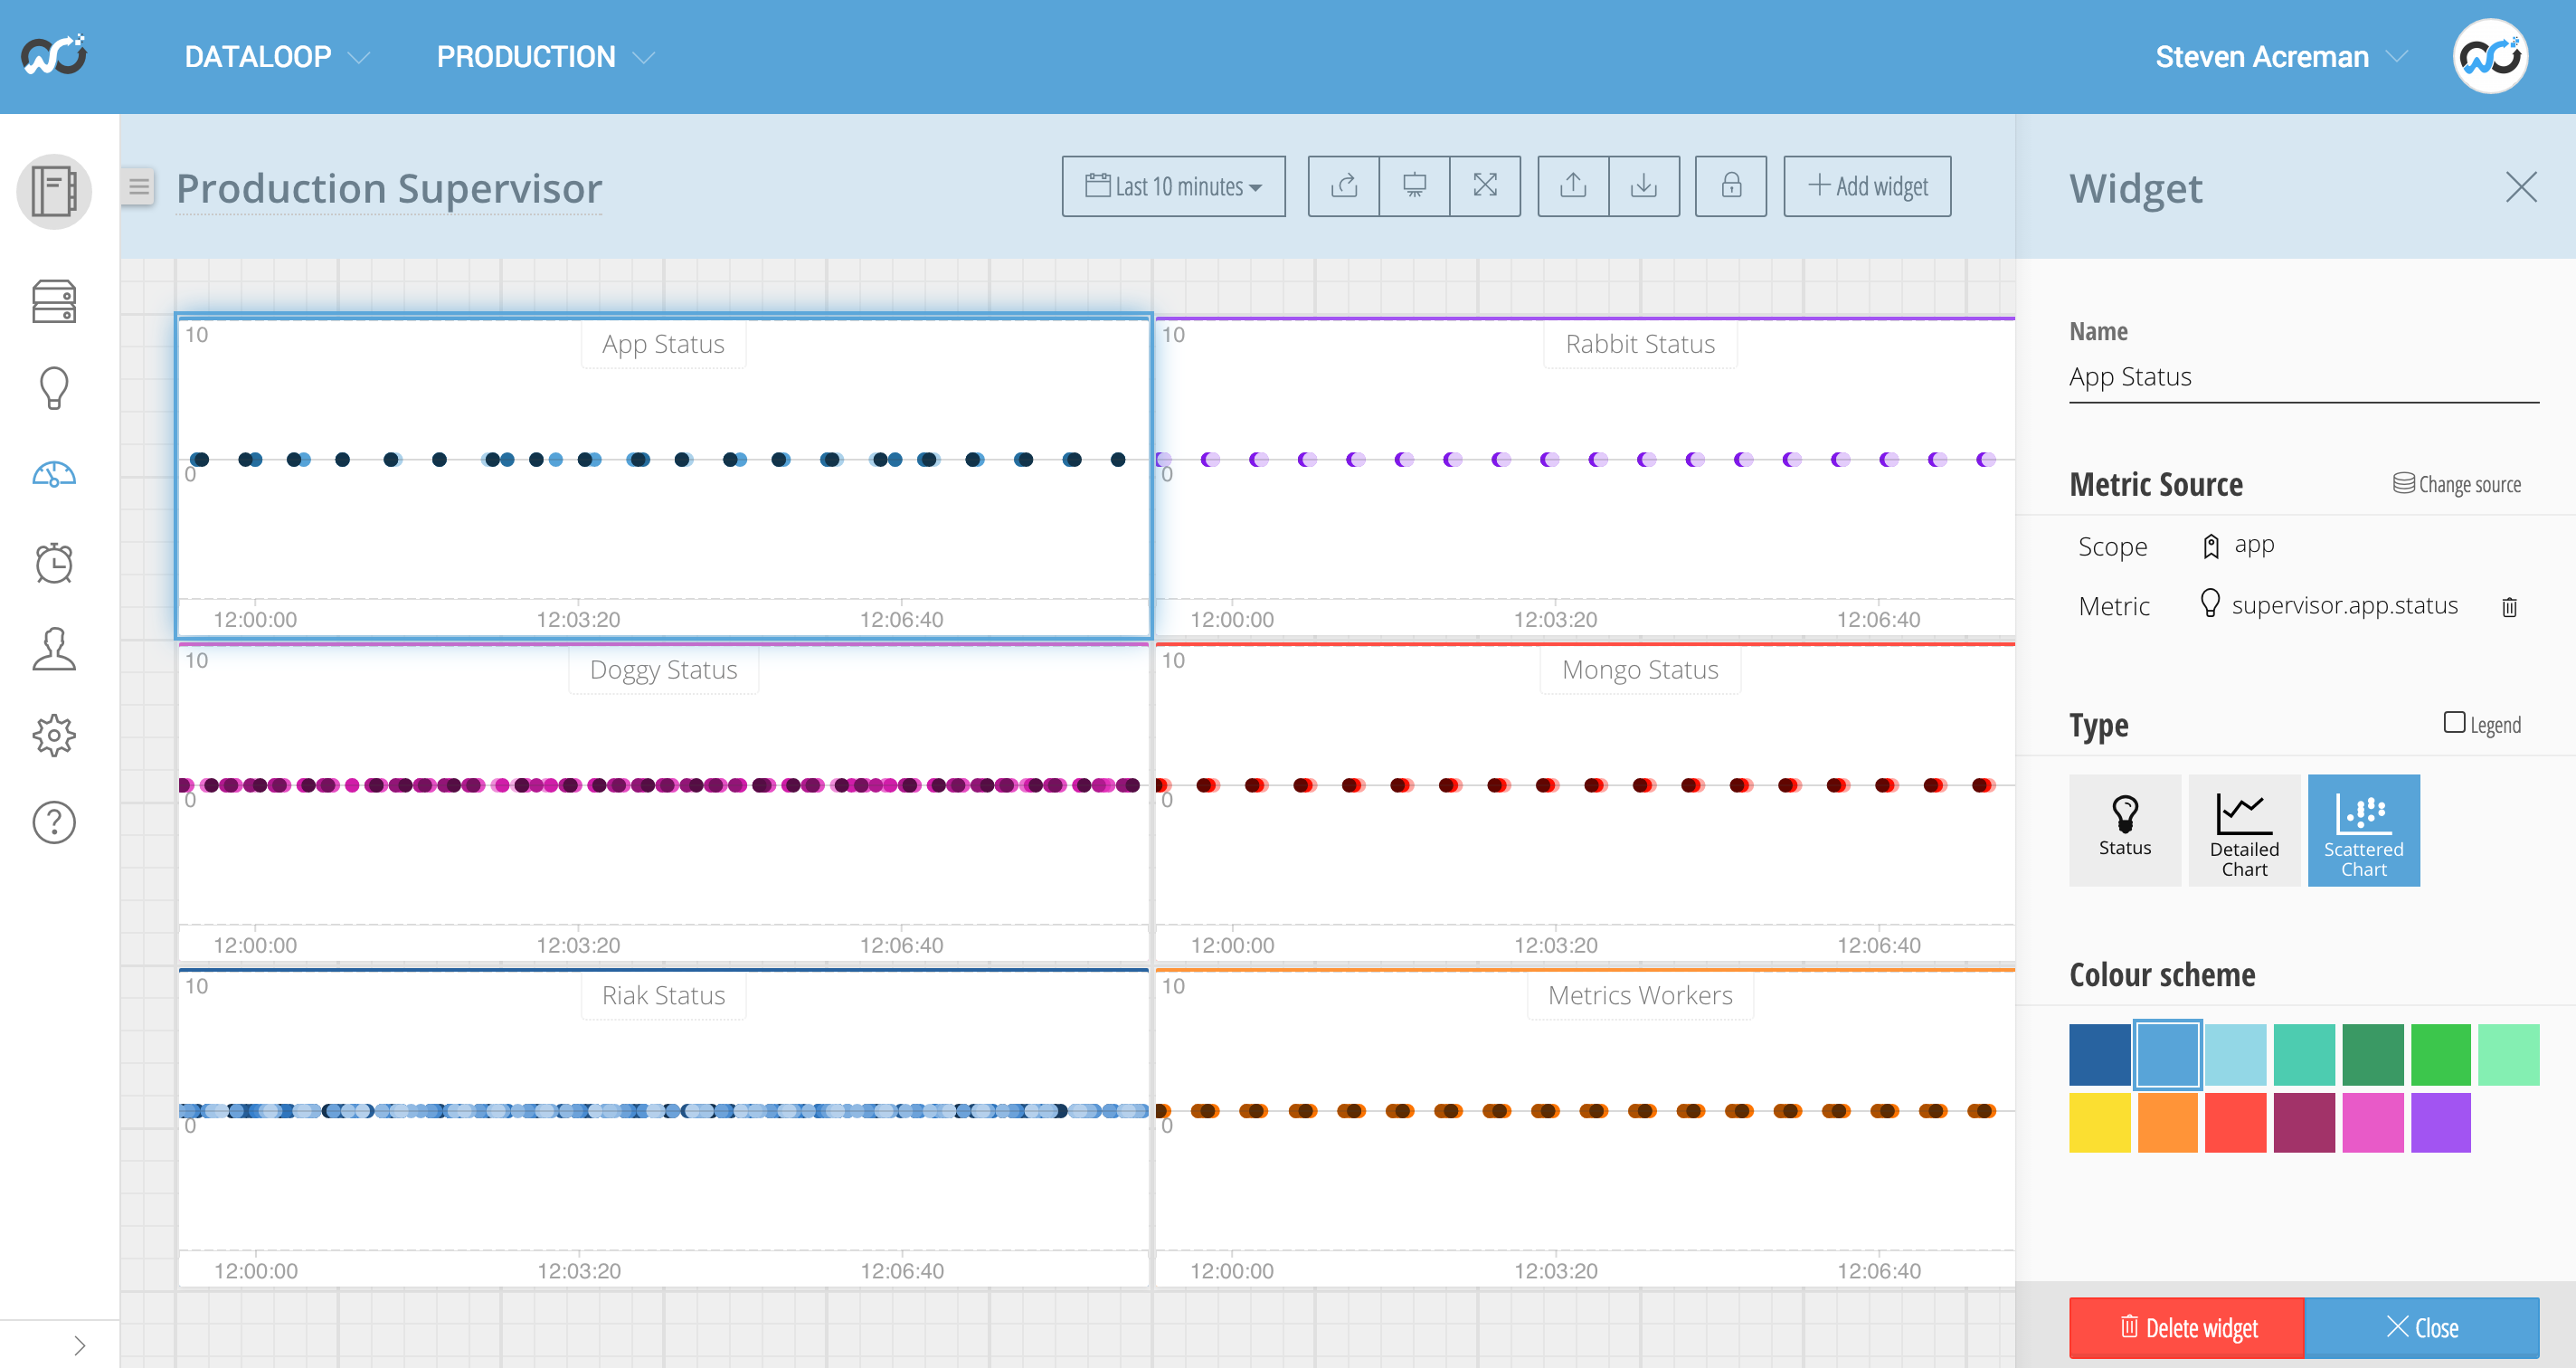
The Scatter Plot is especially useful for seeing if plugin execution has skipped. We also now allow graphing of plugin status metrics (the 0,1,2,3 exit codes from Nagios plugins). Pretty cool for seeing a history of plugin failures. We’re going to also let you graph agent status in the next few days.
Lockable Dashboards
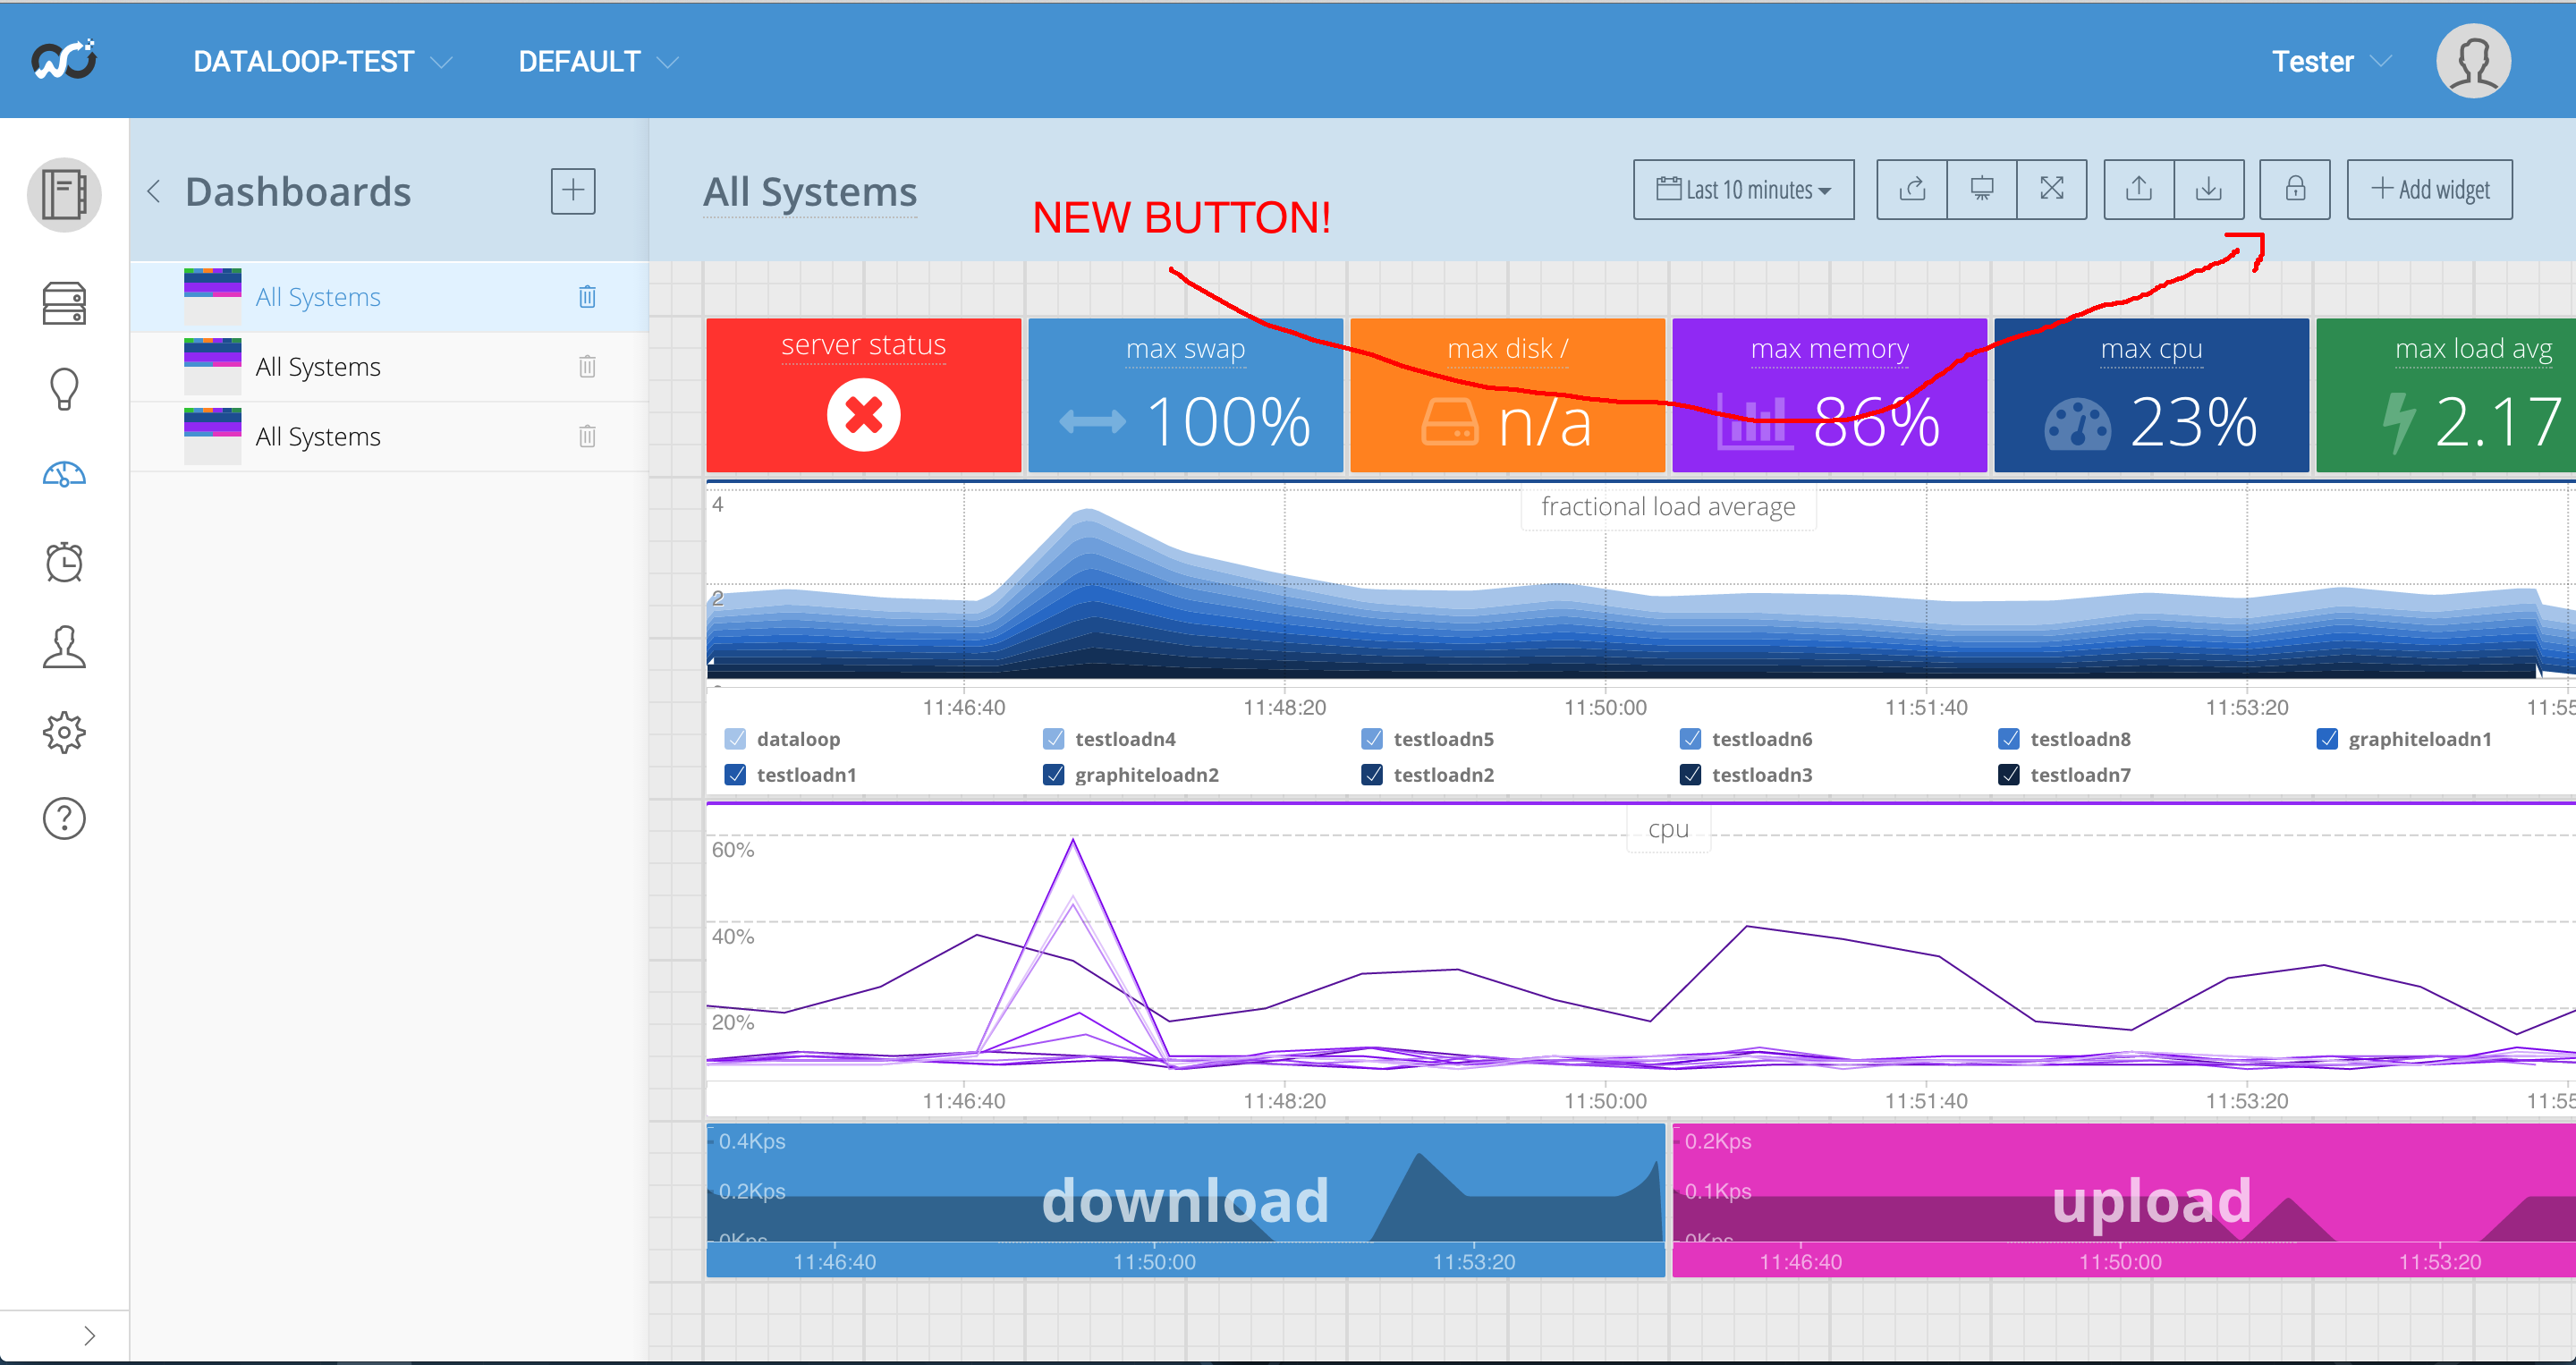
We had a few pieces of feedback that dashboards could get easily messed up by accidentally dragging widgets around when browsing. So we’ve added a lock button to preserve the widget layout when browsing.
API Docs, Integrations and DLCLI
We now have some beautiful API docs located here:
https://documenter.getpostman.com/view/505524/dataloop_public_api/2FyccR
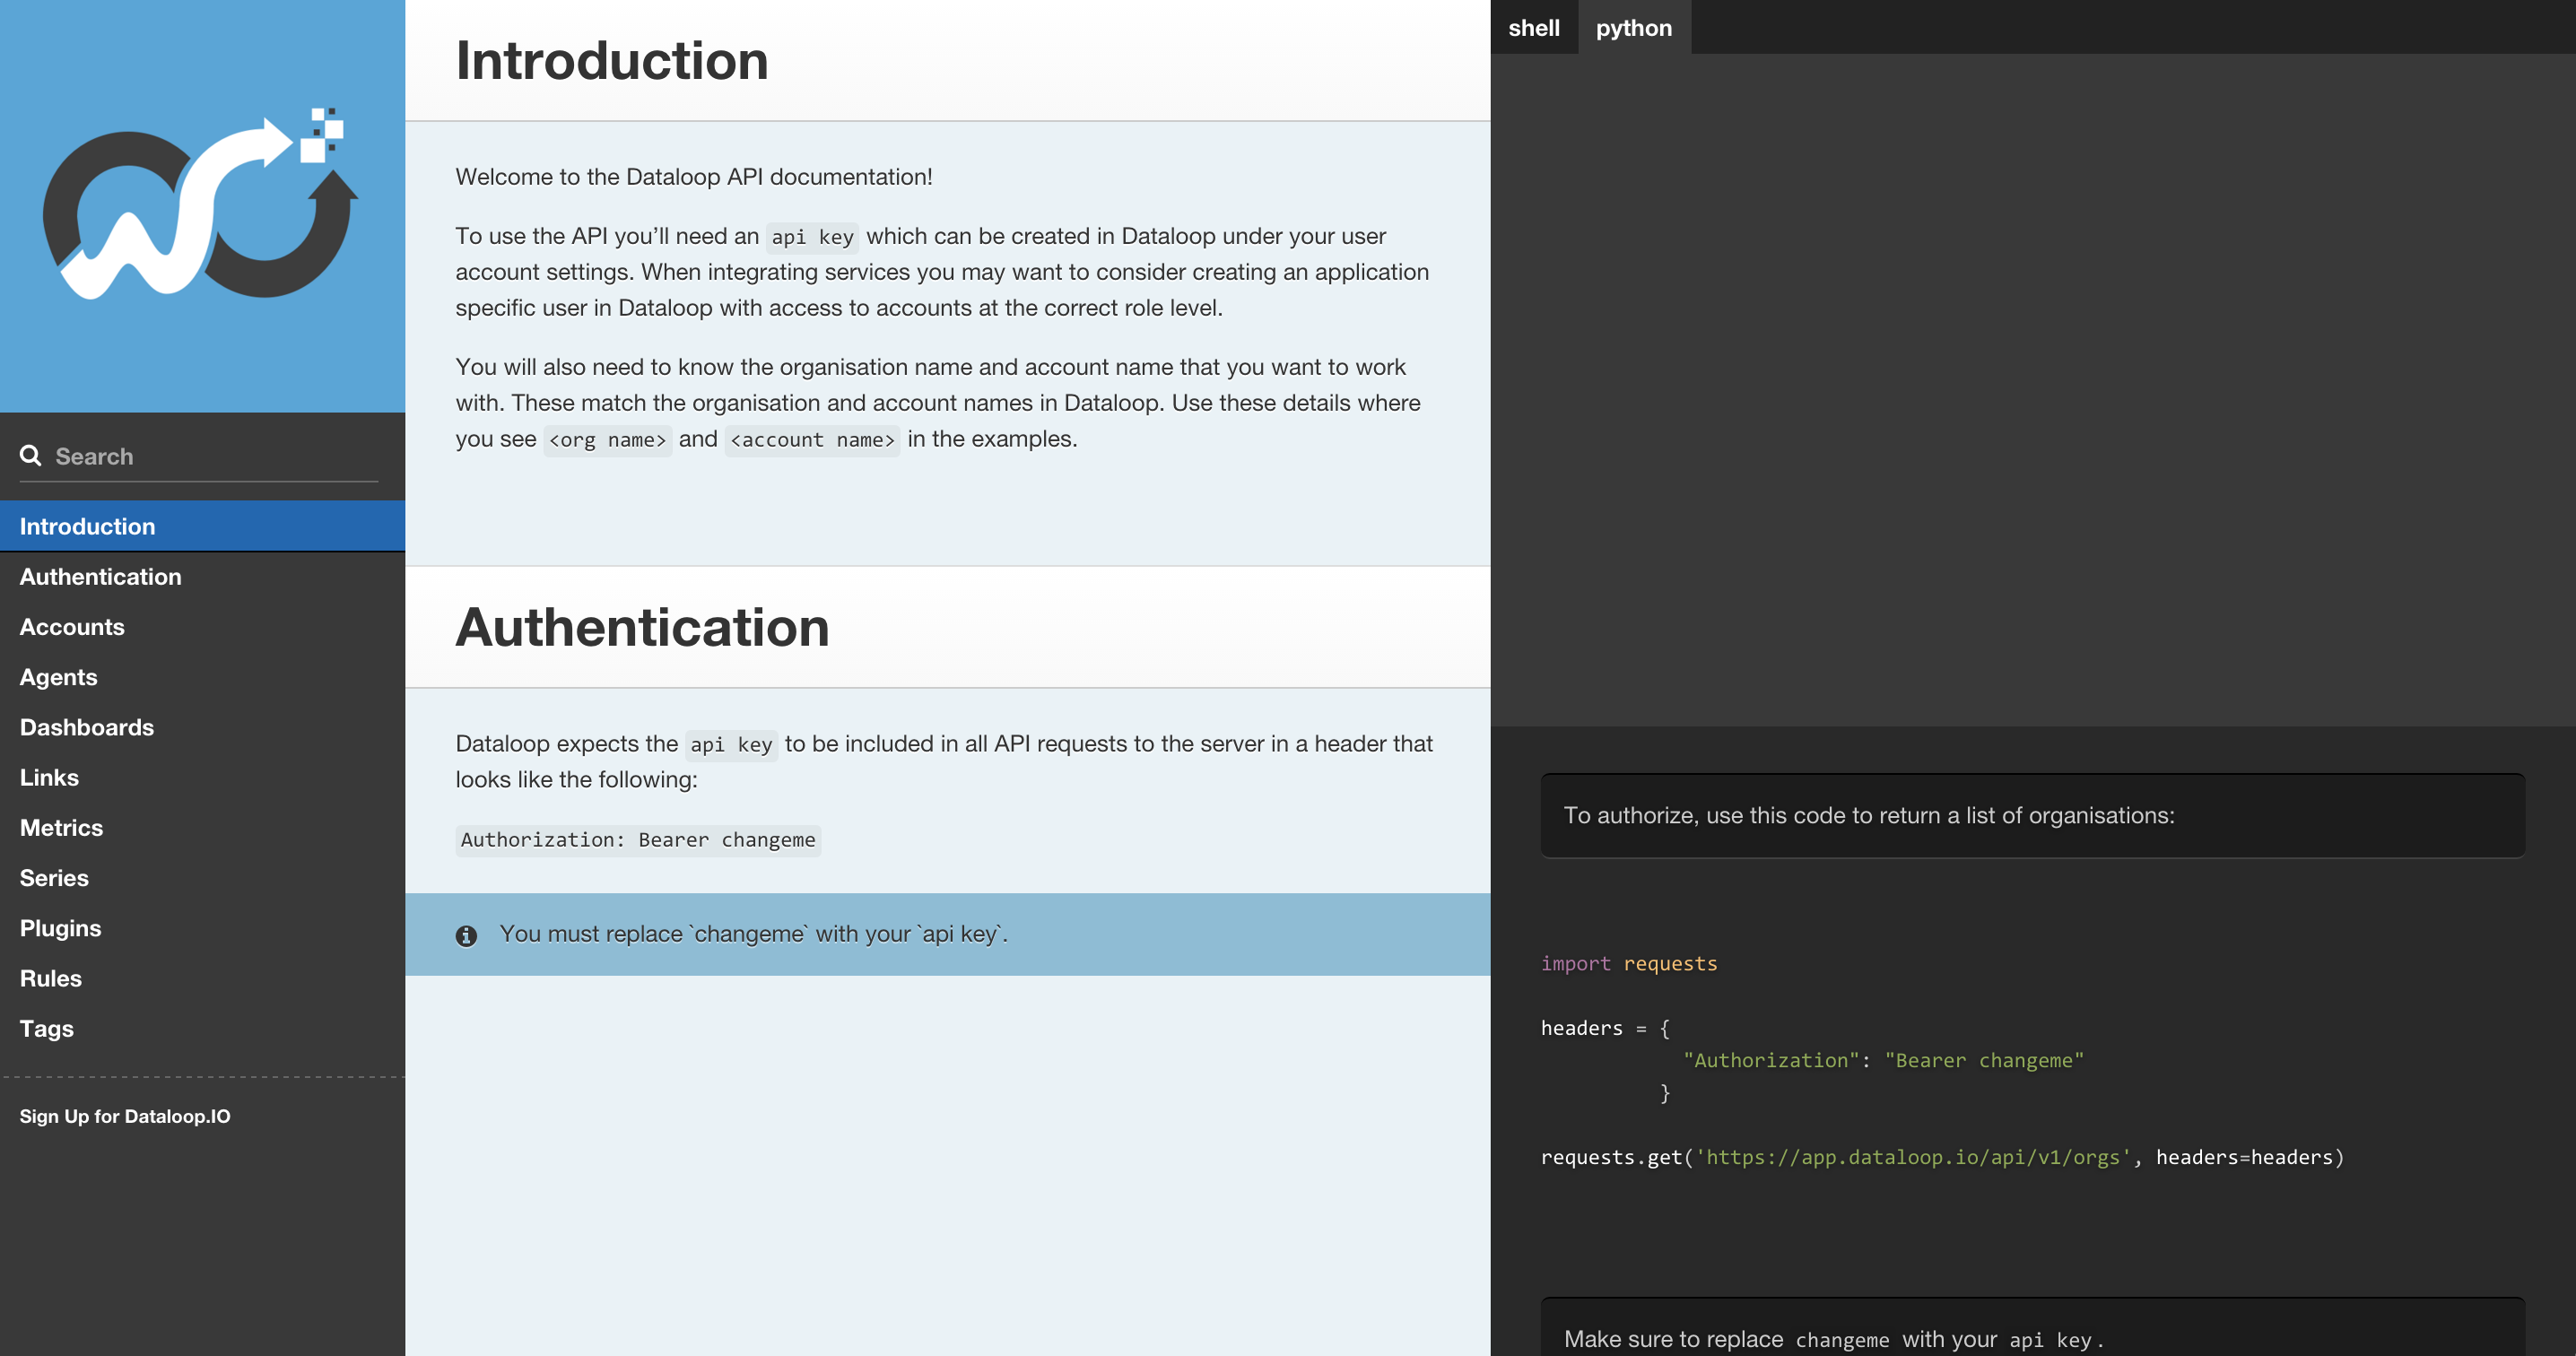
We also built DLCLI which is our command line wrapper to the API. You can use it for automating tasks and even doing a full backup and restore of your accounts.
An example of the things you can do with DLCLI can be read about here:
/blog/monitoring-orchestration/
You can read how to set up an account backup to Github here:
https://support.outlyer.com/hc/en-gb/articles/208281033-Backup-and-Restore
Since adding our Alert Webhooks feature we’ve been working to ensure that a bunch of integrations work properly. You can see the list of documented and tested integrations here:
https://support.outlyer.com/hc/en-gb/categories/201158103-Integrations
Windows Improvements
We’ve spent a fair bit of time improving our Windows agent. It now uses far fewer resources than before and we’ve even fixed up support for running native Powershell in plugins.
If you’re interested in that the details are here:
https://support.outlyer.com/hc/en-gb/articles/208349243-Powershell
Roadmap
We’re often asked what’s next so I’ve put together an approximate roadmap document. You can find it here:
https://support.outlyer.com/hc/en-gb/articles/208778243-Roadmap
Besides adding features we’ve been having fun doing lots of monitoring. Recent blogs cover monitoring ZFS, API’s and various other topics. If you get some time please have a read and leave some feedback.
ZFS Fun: /blog/zfs-on-linux/
API Monitoring: /blog/api-monitoring/