It has been two months since the last update blog. Everyone has been busy laying the foundation for supporting dimensional metrics with Prometheus being our first supported format.
Prometheus Metrics

You can now scrape Prometheus http endpoints using Outlyer plugins. This feature involved changing almost everything in Outlyer and is the culmination of about 8 months of work.
Supporting non-dimensional data (Nagios, Graphite) alongside dimensional data (Prometheus) has been a bit of a challenge but we’re happy that we now have a foundation to build on with the next set of visualisation and alerting features.
Annotations

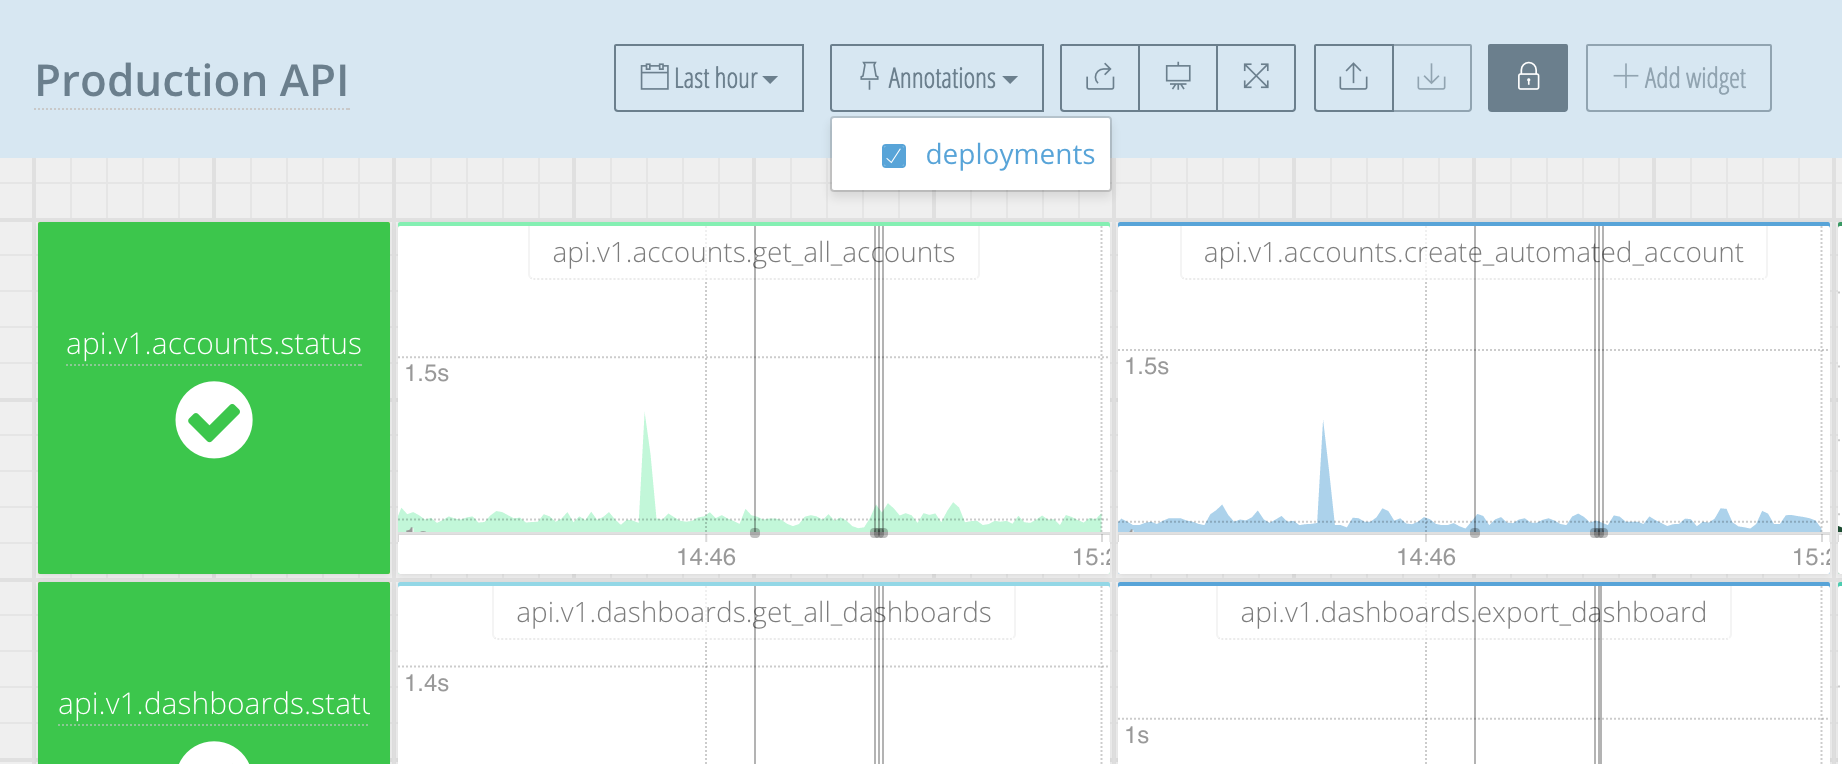
You can now post events into Outlyer with our annotations feature. These are particularly useful when integrated into automated systems. They provide some useful context when troubleshooting issues.
Integrated Help

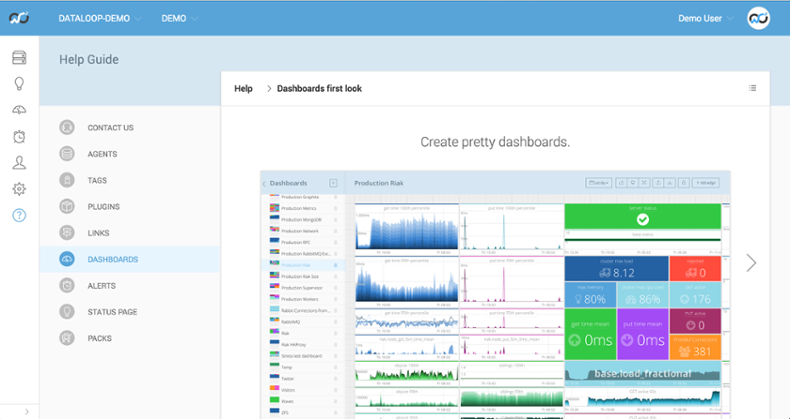
We spent a fair bit of time last month improving the experience for new users. When you create new accounts for your teams they now get a pretty help guide that explains what each page in Outlyer does. This, along with the auto discovery feature we added a few months ago should make the app even simpler to use.
Grafana 3.0 Plugin

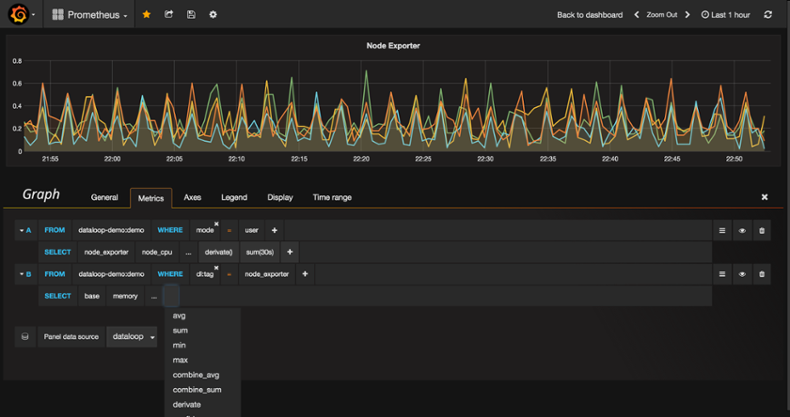
We updated our Grafana plugin to support version 3.0 and added support for multiple orgs, accounts and a functional query language that supports dimensions. We’re currently refactoring some of the database functionality to support series aliases, group by, and various other functions to help manipulate data.