Lots of updates this month including a rewritten alerts system, auto discovery, private packs, wildcard metric support and a bunch more of small changes.
Alerts V2
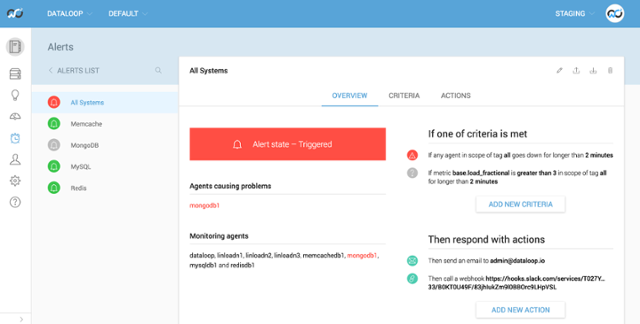
Following on from last month where we completely rewrote the front end in React. We’ve now released the new backend code which makes our alerting system much more reliable. For more information about what we changed there’s a blog post here: /blog/alerts-version-2/
Auto Discovery
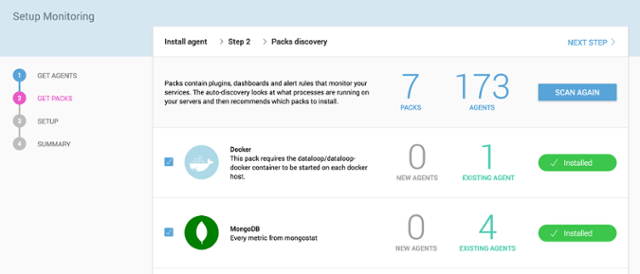
We’ve added a very simple to use installer that guides you through the entire application. From installing agents, to recommending packs and finally plugin deployment and dashboard and rules installation. Behind the scenes this all works on top of our unique auto discovery service which is constantly scanning process lists to see if we have a monitoring pack that’s relevant.
Private Packs
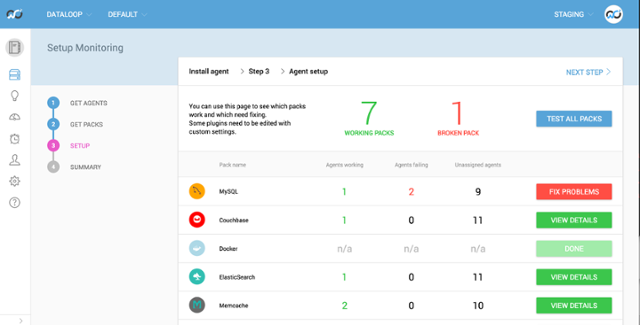
We always wanted to open up our packs platform so that you can create your own private pack library. Power users can now design packs around internal services and make them available to other teams. The first version of this works via the command line utility but we’ll soon be adding more pack creation and collaboration features to the UI. More information about private packs can be found here: /blog/package-management-for-monitoring/
Plugin Settings
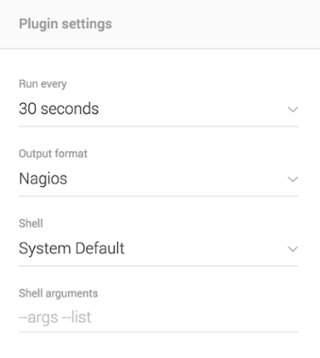
Under the details tab of each plugin you can now set a couple more options. We’ve added the ability to change your plugin run interval from the default of 30 seconds down to 10 seconds or up to 60 minutes, with other options inbetween. The other setting we’ve added that works with the latest agent only is the output format. You can now select Prometheus output format and scrape Prometheus exporters. Right now you won’t be able to see those metrics, but very soon we’ll release a Grafana 3 plugin and soon after that a metrics browser inside Outlyer that will let you write SQL like queries to visualise and alert off multi dimensional data.
Agent Sparklines
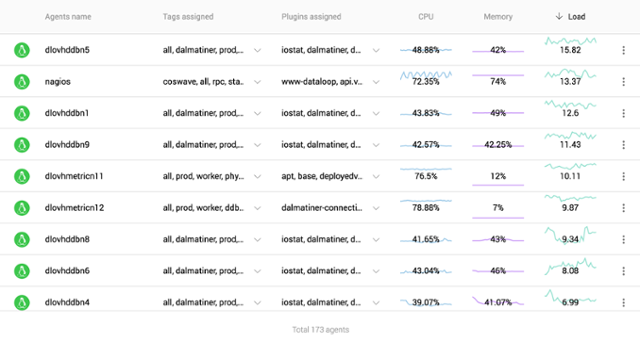
We now display a few more pieces of information on the agents table that helps sort by high cpu, memory or load average.
Wildcard Metrics on Dashboards
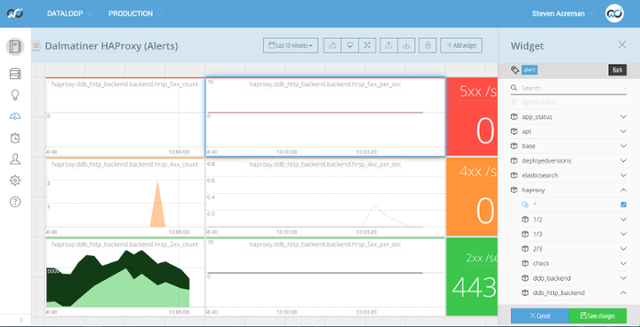
One of our most frequently requested features has been completed. On dashboards you can now click the little * under the metrics explorer to select all metrics. Dashboard widgets will dynamically update as new agents and metrics come in under those paths.