Hot on the tails of the V1.0 Prometheus launch, we’ve extended Outlyer to support the rich metric format exposed by the Prometheus exporters.
As a bit of background: Prometheus is an open source monitoring tool that scrapes https endpoints that expose dimensional time series data collected from hosts, services and applications. You can think of each exporter as a little metrics proxy, converting metrics from the thing being measured into a standardised format that can be collected and used in graphs and alerts.
This adds our 3rd supported metric format, with the first two being the Nagios plugin output format and the graphite line format. Nagios scripts are still the best things to use when you want to quickly write some code to test some infrastructure. Also, lots of third party metrics collection tools contain a Graphite backend and sometimes push is better than pull. However, Graphite data is dimensionless which has become more of an issue since the advent of containers, and which makes Graphite data less powerful compared to Prometheus data.
We think monitoring collection is already too fractured so always want to support the most widely adopted formats rather than reinvent the wheel.
How does it work?

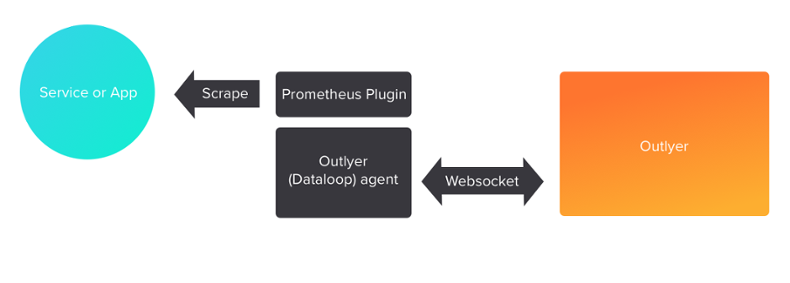
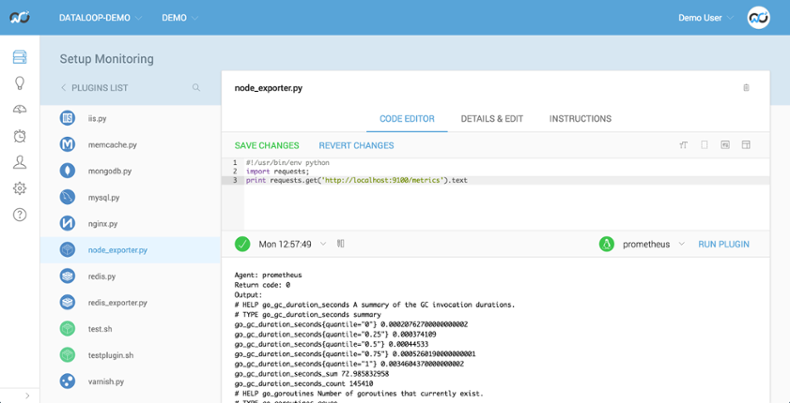
It works in a very similar way to our current Nagios plugins. You deploy the Outlyer Agent onto each of your servers and this runs a plugin that scrapes the Prometheus metrics. The plugin can be a simple curl or a few lines of Python to return the data on stdout. We then return that data to Outlyer and make it available for use in graphs and alerts.

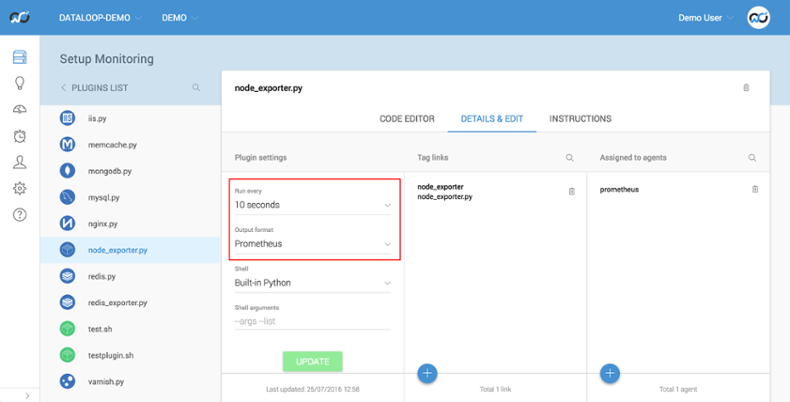
The only difference is you now need to select the plugin format so we know how to parse the data.

Here you can see our node exporter plugin is scraping for Prometheus data every 10 seconds.
What’s next?
We’re currently working on a new metrics explorer in Outlyer to make better use of the Prometheus dimensions in both dashboards and the alerting system. There’s also some work going on to create auto discovery packs that will detect services and automatically instrument them to save time setting up collection for services like Kubernetes.