The words ‘Real-Time’ can be found on the glossy websites of many monitoring products. Rarely do you find any context behind those words. Does it really mean ‘Real-Time’? Or, is there some noticeable lag between metrics being collected, sent and displayed. The truth will vary quite a bit between products and yet the marketing words remain the same which is very confusing.
The difference between Real-Time that is almost instant versus Real-Time measured in minutes can mean the difference between useful and useless depending on the scenario.
I started off thinking that perhaps this blog should be about benchmarking the top monitoring systems but then decided that perhaps that would be inflammatory for a vendor to do directly. There are many factors to consider when looking at a monitoring system and focusing on a single table of timings could come across badly. However, if somebody else wants to do a benchmark I’d happily link to this blog.
I’ll try to instead describe the various considerations that need to be made when looking at real-time metrics. Most of these problems are not immediately obvious but soon present themselves when you start to operate at any kind of scale.
Starting Simple (Historic)
The most basic setup is to send metrics into a central database which is then be queried by a front end. A good example of this setup would be InfluxDB and Grafana. Once you get to a certain scale you have two problems to solve; write performance and read performance. Unfortunately, if you design for high writes you will often lose proper Real-Time characteristics which is often the case with solutions based on Hadoop like OpenTSDB. Often due to the nature of eventual consistency your metrics may take a few minutes to appear.

Starting Simple (Realtime)
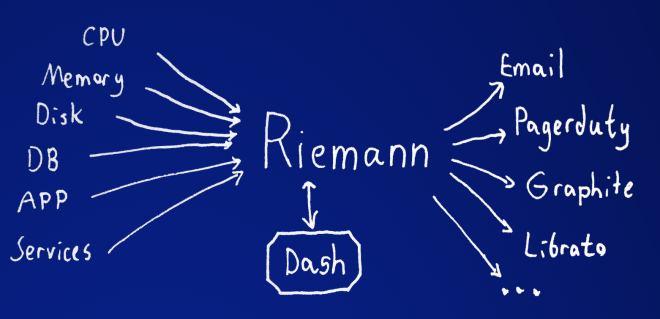
Lets say you really only care about what’s happening right now. This becomes quite a simple problem to solve. Send the metrics to a central stream processing system and pump the metrics directly to the browser as they arrive. I believe this is what the Riemann dashboard does and you get really low latency metrics as a result.

Historic and Realtime
So it’s clear from above that you need a stream processing system like Riemann or Heka that can split your metrics and send some to long term storage for historic viewing, and also send metrics in realtime to your screen for low latency visualisation. Problem solved! Or, not quite.
What happens now is when the graphs render they will pull from your historic metrics database which could be a few minutes behind due to processing (batching, calculations, eventual consistency etc). Then live updates get pumped onto the end of the graph directly from the stream. You now have a graph that displays good data up to a few minutes ago, then a gap of nothing, and then whatever data has been pushed to the browser from the stream since you opened the page.
Solving the Gap
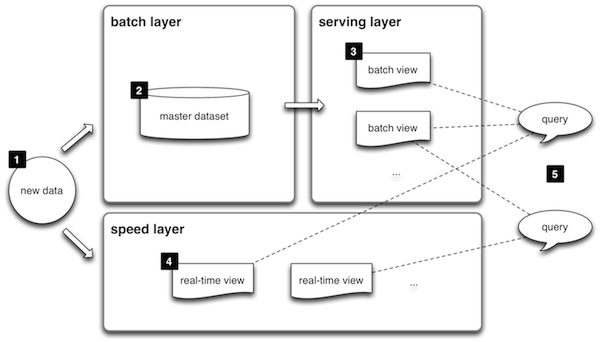
At this point you can probably think up lots of ways around the gap problem. Storing data in the browser to mitigate some of it, perhaps putting in some caches. The reality is that it becomes very complicated. Fortunately, others have solved this problem already and documented a pattern that seems to work pretty well for this type of problem. They call it the Lambda Architecture.

http://lambda-architecture.net/
We have already written a blog about how we scale our monitoring platform but didn’t go into too much detail about how we present data by seamlessly joining historic and Real-Time with low latency (milliseconds) and no gaps.
Internally we use Riak as our master dataset and Redis in our serving layer. Metrics get split into three streams; storage, alerts, and live updates that get sent directly to open dashboards.
For storage we split that into Short Term Storage (STS) and Long Term Storage (LTS). Metrics are pulled off durable queues and pushed initially into STS (Redis) where after a short duration they are then rolled up into LTS (Riak). When queries are made on dashboards our API pulls from STS, LTS and keeps an SSE connection open for the live updates.
Although our last blog post talked about our micro service workers all being written in NodeJS we have unfortunately had to rewrite a couple of them due to problems with parallelism and fault tolerance. So we have a few Erlang workers now in testing that will eventually replace our V1 node workers (not all of them, just the ones in the metrics and alerts pipelines). I’ll do a blog about why the switch from Node to Erlang for some workers in future.
So with all of this work what do we get? Mostly no realisation by users that any of this is happening. They fire in their 1 second granularity metrics into Outlyer and they appear in their dashboards instantly, with the ability to change time ranges and it all just works transparently with no gaps and a perfect representation of the data. Same deal with alerts.
As with everything we have made various trade-off decisions which are mostly around immutability of data and could probably be another blog topic on their own. Currently we are working towards the goal of keeping all data at raw resolution forever. Whether we achieve that I don’t know, but we’ll definitely get close :)