We had a request today from one of our customers to look into supporting tags on StatsD metrics in Outlyer. The answer was so surprisingly easy I thought I’d do a blog post about it.
If you already have StatsD running it’s really quick and simple to update the configuration to duplicate metrics into Outlyer via the StatsD Prometheus Exporter. We’re going to set this up.

With the exception that where you see Prometheus imagine that’s the Outlyer agent running a plugin to scrape the data.
You don’t need to change anything in your code. Simply add a repeater backend to your current StatsD server.
| You can optionally now start sending in tags alongside your metrics by using the dogstatsd notation i.e. appending ** | #tag:value,another_tag:another_value on** onto the end of your metrics. |
Step 1
Download a copy of the exporter from here and start it on your StatsD server:
https://github.com/prometheus/statsd_exporter/releases
Just starting it under nohup would be good enough for now. Longer term you probably want to run it under a supervisor. Here’s what it looks like when run on the command line.

As you can see it has started listening on port 9125 and is exposing the metrics sent to it on port 9102. You can change all of that stuff with command line options if you want. To check it’s working you can curl http://localhost:9102/metrics and you should see a bunch of stats from the exporter itself.
Step 2
Modify your StatsD config to additionally forward metrics to the statsd_exporter. Here’s an example snippet:
{
  graphitePort: 2003,
  graphiteHost: "statsd.acme.com",
  port: 8125,
  mgmt_port: 8126,
  graphite: { legacyNamespace: false },
  repeater: [ { host: '127.0.0.1', port: 9125 } ],
  backends: [ "/opt/statsd/backends/graphite", "/opt/statsd/backends/repeater" ]
}
Your StatsD config file may look a bit different. The key lines to alter are the repeater: settings to point to the statsd_exporter port. Also the backends: to enable the repeater backend.
Step 3
Install the Outlyer agent and configure a plugin to scrape the exporter. Creating a plugin is pretty easy in Outlyer.

For easy copy and paste here’s the 3 lines in statsd_exporter.py.
\#!/usr/bin/env python
import requests
print requests.get('http://localhost:9102/metrics').text
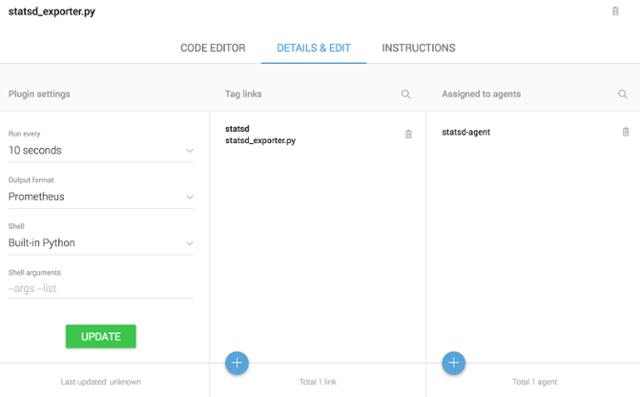
Now go to the details & edit tab and change the plugin interval to 10 seconds, output format to Prometheus and apply it to the agent on the StatsD server so it will deploy and start scraping.

Step 4
You’re done! These metrics are now available inside Outlyer or Grafana via our data source plugin.

This is also a really simple way to try Outlyer out if you’re currently using StatsD. Sign up, install an agent on the server and follow the above 3 steps to get up and running in minutes.