This is a guest post from Avi Freedman from Kentik
Tools, tools everywhere
We all know there is a plethora of infrastructure tools out there: ping/traceroute tools, configuration mgmt, metrics, logs, APM, NPM, something for netflow…
The fundamental question is, of course: how do you know when there is a problem, and where the problem is: app, server, network? If I pinged something in South Africa and it didn’t work — do I have any traffic there? The APM says it’s not a problem, but does that mean there is a problem in the network, or is there a server problem? While the APM and metrics tools are getting more sophisticated (the latter, for example, doing distributed tracing), the network side of things is often missing. There are many different reasons for that. At Kentik, we actually think that it is healthy if non-network people (those running servers, applications and even business data) know if there is a network problem. In fact, web companies, server providers and infrastructure providers want other groups to know this information. However, tools used for this type of data (e.g., Cactus) are difficult to use and adopt on the operations/SRE side.
The Network Knows
While the application generates the traffic, it is the network that delivers it; hence, the network holds a lot of different, important information. In addition to the traditional understanding of the network (some packets and bytes that went from this IP address and port to that), there is a lot more interesting network layer information that will show not only the performance of the network, but also of the application—and that is the missing part of what a lot of people do with APM.
Many current tools show what should be, aka what’s specified, authorized, coming from the web server, but when you get into attacks, which are more of an availability thing, a lot of that traffic will not come from the web server, because it is someone probing different parts of the network. The network sees that unauthorized, unspecified traffic as well.
The network also knows the routing, aka the path traffic will take, and whether it’s internal, external, if it’s your or others’ infrastructures.
Network Traffic Instrumentation
Modern network devices can send traffic summaries, aka “NetFlow” (often called sFlow, or IPFIX). NetFlow is the metadata of the traffic—it’s the summary of the headers of the traffic. For pure NetFLow and for IPFIX there is no actual packet data that goes over, as the router observes either sample of the headers, or sample of the flows. The flow is a bunch of packets that went to or from the same place. It is called a “give tuple”: PROTOCOL, SRC/DST IP, SRC/DST PORT..
What we are ultimately trying to do is get the summary of this data, store it, and try to analyze it. Basically, it’s always been a big data problem that required distributed systems—which are run by developers who don’t talk to each other.
In other words, you can generate this data, but the problem is what to do with it, and I’ll write here about a couple of quick ways to deal with it.
Other Network Telemetry
There are other kinds of interesting network data:
- SNMP (you can think of NetFlow as a double-click into SNMP data);
- “Streaming telemetry” (every detail of a device and its software)—the idea being that your networking devices will push all that stuff at your metric system which will be thrilled to ingest 100 million metrics (you will need modern time-series backends)
- Logs, telling you when the interface up/down, about fan+cpu+optic failures, re-config, routing up/down, memory or CPU issues
- Configs
- Topology
The awesome news for a vendor is that there is still a ton of work to be done for decades to integrate all this stuff from the applications and the servers, the network and config. We are, of course, starting with the basics.
Network Nerd Use Cases for Network Knowledge

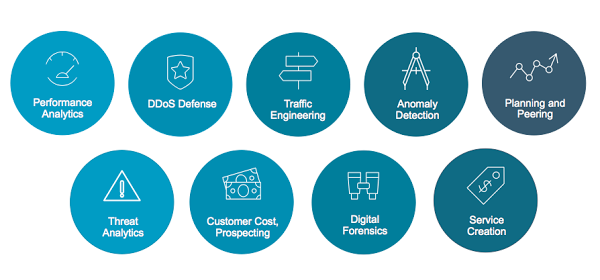
For network nerds, there are a lot of network-specific things to get done, and some of that starts bleeding into other areas. A business use case might be an internet service provider that wants to know their customer cost. Perhaps an enterprise wants to know the security problems, and the folks who run the infrastructure want to know what their infected machines are. Network people are just beginning to learn that you can get performance data about all that.
But Not Just for Network Nerds!
While we started working with network people who have been struggling with these problems, this actually doesn’t have to be for networks folks only.
We actually believe that it’s all three aspects—applications, servers, network—that need to collaborate.
How do we tie these systems together?
You can actually make flow look like metrics and correlate there: at Kentik, we have a Grafana plugin which talks to our backend, making the data look like metrics.
With protocols, this is fine since you only have around 250 values, but the system is really not designed to work with IP addresses, where you have 10 million different values over 90 days. However, there are some of the protocol attributes that you can do well; the other thing to do is have a flow system that can expose APIs, so people can use that.
The main thing that the whole world of flow tools needs to make it easier to use for people who are not skilled in networks.
OSS and Vendor Options for Flow
There are open source tools out there: pmacct, nfdump/nfsen.. but none of them are clustered; all of them store billions and trillions records of day on one computer.
There are a couple of vendors in the commercial space, including my company, Kentik (SaaS) and Arbor (an older appliance), and we see a lot of people DYI it. They mostly use Elastic or pmacct front-ending Hadoop-ish SQL. This is a really hard problem. Even if your database doesn’t understand what a prefix is or what PGP is, to combine it can be interesting.
The good news is: NetFlow and related protocols are easy to replicate (with Kafka or something called samplicator) and send to multiple places: it is stuff that is very easy to experiment with.
What is so hard about it?
To make full use of it, you need to combine geography, routing information, sometimes threat intelligence, info on what application it is, what user it is, what data center it is…this is not contained in the flow, so you’ll need to fuse it.
This can be a lot of information: flow can be trillions of records/day – think of it as a sampled superset of all of your logs. OSS flow tools don’t cluster, so can’t store at scale, and they don’t integrate with other systems. Metrics systems often choke on the high cardinality of IP addresses and port #, etc.
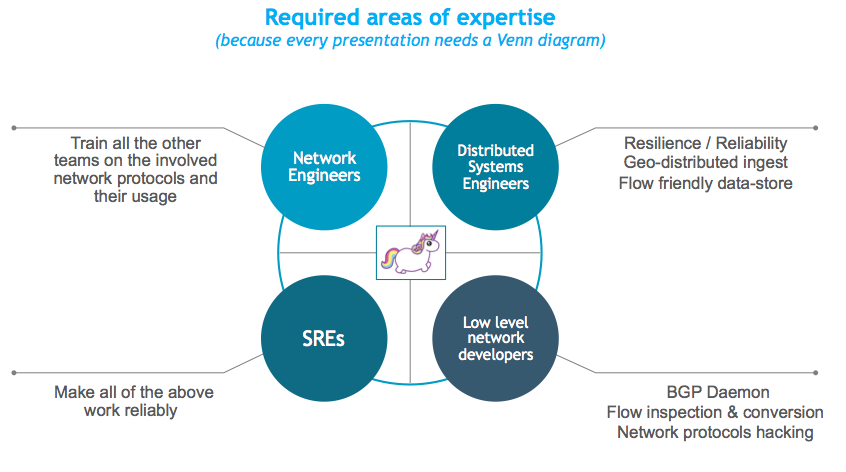
DIY is hard but possible: it typically requires involving a bunch of different teams:

Don’t give up!
Not only is there some work already being done in the area, but there are some simple things you can see looking at network tools. This is definitely the case where it is better to do something rather than nothing.
If all you have is a metrics database, you can actually take data from Flow, from watching packets, from a server.
In short, you’ll have to:
- Get the data.
- Fuse the data.
- Store the data.
- Use the data.
- Share the data.
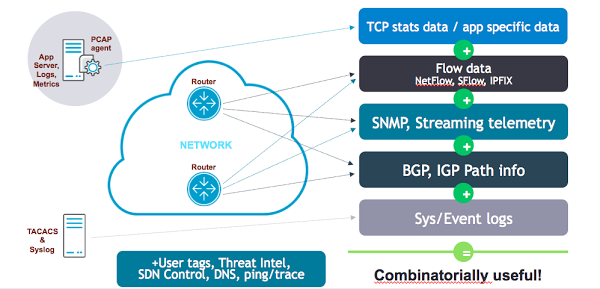
Where can you get this data? Here is one visual representation:

A Broader View of “NetFlow”
The traditional understanding of netflow is getting bytes and packets from here to there. However, what is really interesting to bring into the APM view is data from servers, or even some network elements, like queue depth, retransmits per flow, TCP latency, application latency.
You can get that data from host software like nProbe, sensors/taps, web server logs (Nginx), or Cisco AVC supported routers.
In short, flow or BGP or SNMP or DNS or logs alone are not enough. This becomes much richer when combined with:
- Performance and layer 7 information
- BGP attributes
- Geography
- Tags (rack, department, customer…)
- Config changes and software versions
- Threat intelligence and known-bad IPs
Fusing should be near real-time, performed at ingest and data specific.
In summary…
Where we should all be heading is combining application, server and network data. There are problems that occur in all three “things”, and they could be related. Network people should look at some of the monitoring work that is being done, and if you hear NetFlow, don’t think that just tune it out as just relevant to DDOS or peering.
