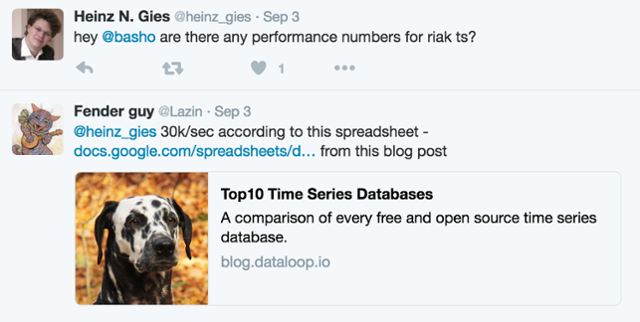
Our Top 10 Open Source Time Series databases blog has been very popular, with over 10,000 views and growing. It sat on the front page of Reddit /r/programming for a day or two and we got a bunch of traffic from HackerNews and DBWeekly. The raw data in the spreadsheet that accompanies the blog has been constantly updated ever since by a team of volunteers which now includes some of the database authors.
It has quickly become an important point of reference for anyone looking for a new time series database. It was also pretty cool having our sheet referenced back to us as we were collecting more data for it.

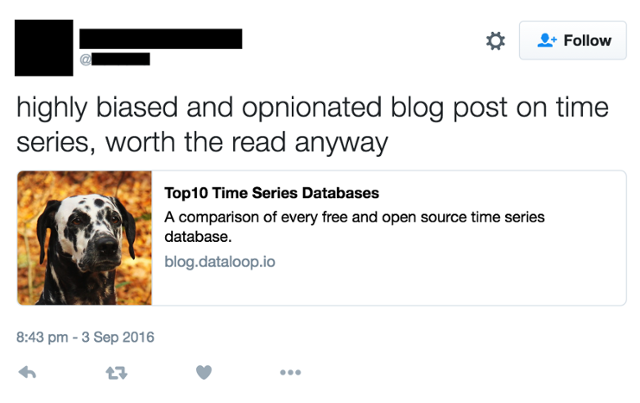
On the other end of the spectrum, someone on Twitter called the blog post “biased”. While it’s true that the blog post is opinionated—which we called out in the first paragraph—I’m not sure about it being biased. Surely I’d need a motive.
I help promote the DalmatinerDB database and we use it at Outlyer, but if something better came along I’d give it a better review. It certainly doesn’t score highest in every row, although it does win in terms of reproducible benchmarks.

The ‘worth the read anyway’ bit is probably the highest praise anyone could ever ask for :)
To make things 100% clear, we make zero money from promoting any of these databases, and it actually benefits Outlyer more if the blog posts are brutally honest and credible from a technical perspective.
The part that caused most uproar was the benchmark results. Despite the spreadsheet being at least 95% unarguable fact, we did seem to attract the religious elements of various databases who felt compelled to defend the performance of their chosen solution. Admittedly, the spreadsheet did start off a bit loosely worded and has hardened up over time.
We’re now at a stage where those scores are pretty defendable and are colour coded with reference links in the spreadsheet. With that in mind here’s the list again, ordered by performance.
Top Write Performance - Single Node
-
DalmatinerDB (3 million metrics / sec)
-
Akumuli (2 million metrics / sec)
-
Prometheus (800k metrics / sec)
-
InfluxDB (470k metrics / sec)
-
Graphite - custom setup (220k metrics / sec)
-
KairosDB, Blueflood, Graphite, Hawkular, Heroic, MetricTank (60k metrics / sec)
-
Riak TS, OpenTSDB (32k metrics / sec)
-
ElasticSearch (30k metrics / sec)
-
Druid (25k metrics / sec)
Pro Tip: If you disagree with any of these numbers then open the spreadsheet, find the write performance row, check the colour to see how accurate it is and click the link to find out why it got that number. If you still disagree provide a link to some data that can be verified and we’ll update it.
Top Query Performance
Fast: DalmatinerDB, InfluxDB (small queries)
Moderate: ElasticSearch, InfluxDB (medium size queries)
Slow: KairosDB, Blueflood, Hawkular
We took InfluxDB’s awesome query benchmark work and extended the test software it to cover DalmatinerDB. They had already benchmarked InfluxDB, Cassandra and ElasticSearch so it gave us a head start.
Any Cassandra backed databases without an external index got an inferred Slow score.
What about the ones not listed? I think we can assume that if nobody is willing to provide a benchmark then they probably aren’t fast. There isn’t much incentive to publish slow or mediocre scores. There is a discussion under way currently to start performing benchmarks for some of these databases, a bit like Aphyr did with Jepsen for testing data safety claims. Although, we’re a busy bunch of people and would prefer if database authors or users would submit some.
I’m sure we’ll get some more comments refuting various performance claims after this blog. However, we now have exact methods to benchmark both write performance and query performance. The best course of action to get us to change anything here is simply to run the benchmarks and send us the results.
Happy benchmarking!
Keith Nicholas
12/20/2017, 5:50:46 AM
When looking at DalmatinerDB it has a section with a very unexplained design decision… “DalmatinerDB allows for metric input in second or even sub-second precision. At those short intervals it is more important to allow the majority of the metrics to be written correctly than to guarantee that every metric has every second accounted for.” This sounds like it doesn’t store all the data as it is given to it? so isn’t this a big Con to the Db, it throws away data? It doesn’t really explain itself and seems to be a massive red flag. So, for example, if you had a power meter, and you were sampling the change in power, if you aggregated that data it wouldn’t reconcile with what the power meter said?