This is the final installment of our 4-part “Monitoring Kubernetes” series.
- Part 1 discusses the components of Kubernetes and why it is hard to monitor Kubernetes and more broadly, containerized applications.
- Part 2 (Collecting Metrics with Heapster & Prometheus) covers how to scrape metrics from each Kubernetes components and how to monitor your cluster using open source tools like Heapster and Prometheus.
- Part 3 (How to Monitor Kubernetes with Outlyer) covers:
- How to set up the Outlyer agent in your cluster using Kubernetes Secrets and DaemonSets
- Use the Outlyer Kubernetes integration to take advantage of our default dashboards and alerts for Kubernetes
- Use the Outlyer Redis integration to take advantage of our default dashboards and alerts for a Redis cluster
- How to create custom dashboards and alerts using the Outlyer web UI
This post approaches what are the top metrics you should be aware of when monitoring your Kubernetes cluster.
Introduction
Kubernetes is one of the fastest growing open source projects and the most common solution for container orchestration. On March 2018 it became the first graduated project by the Cloud Native Computing Foundation and it currently has more than 35k stars and 12k forks on GitHub. Besides, it counts on a large and active community, which makes it evolve very quickly.
 Google Trends (Last Two Years): Kubernetes
As shown in part 1 of the “Monitoring Kubernetes” series, Kubernetes implements a complex architecture and is hard to monitor due to the ephemeral nature of containers. On top of that, it provides many types of workloads and each component expose tons of metrics. Part 2 showed where to find and how to collect these metrics, however, which subset of them are the most important ones to ensure your cluster is healthy and working properly? After reading this post you will know how to answer that and hopefully, it will become much easier for you to create proper alerting rules and take the most advantage out of the Kubernetes Autoscaling feature.
Core Metrics: Kubernetes Nodes
Kubernetes was designed to provide an abstraction layer on top of physical machines (or VMs) so that a machine failure would not affect the running of your applications if the cluster still has available capacity to reschedule the failed workloads.
That, of course, is an undesirable scenario that every system administrator wants to avoid. Thus, it’s crucial to be able to detect problems before a node fails. Monitoring CPU, memory, disk and network (core metrics) will provide valuable information to ensure the health of your nodes.
In Linux, core metrics are mainly exposed by the kernel under /proc directory and include (but are not limited to) metrics like system load, CPU, memory and filesystem usage, disk writes and reads, network received and transmitted, packages dropped, and so on.
In Outlyer, node core metrics are automatically collected as soon as the Outlyer agent DaemonSet is deployed to your cluster (see part 3 to learn how to set up Outlyer in Kubernetes). Besides, the Outlyer Hosts Dashboard shown below and default alerts are automatically set up when your account is created.
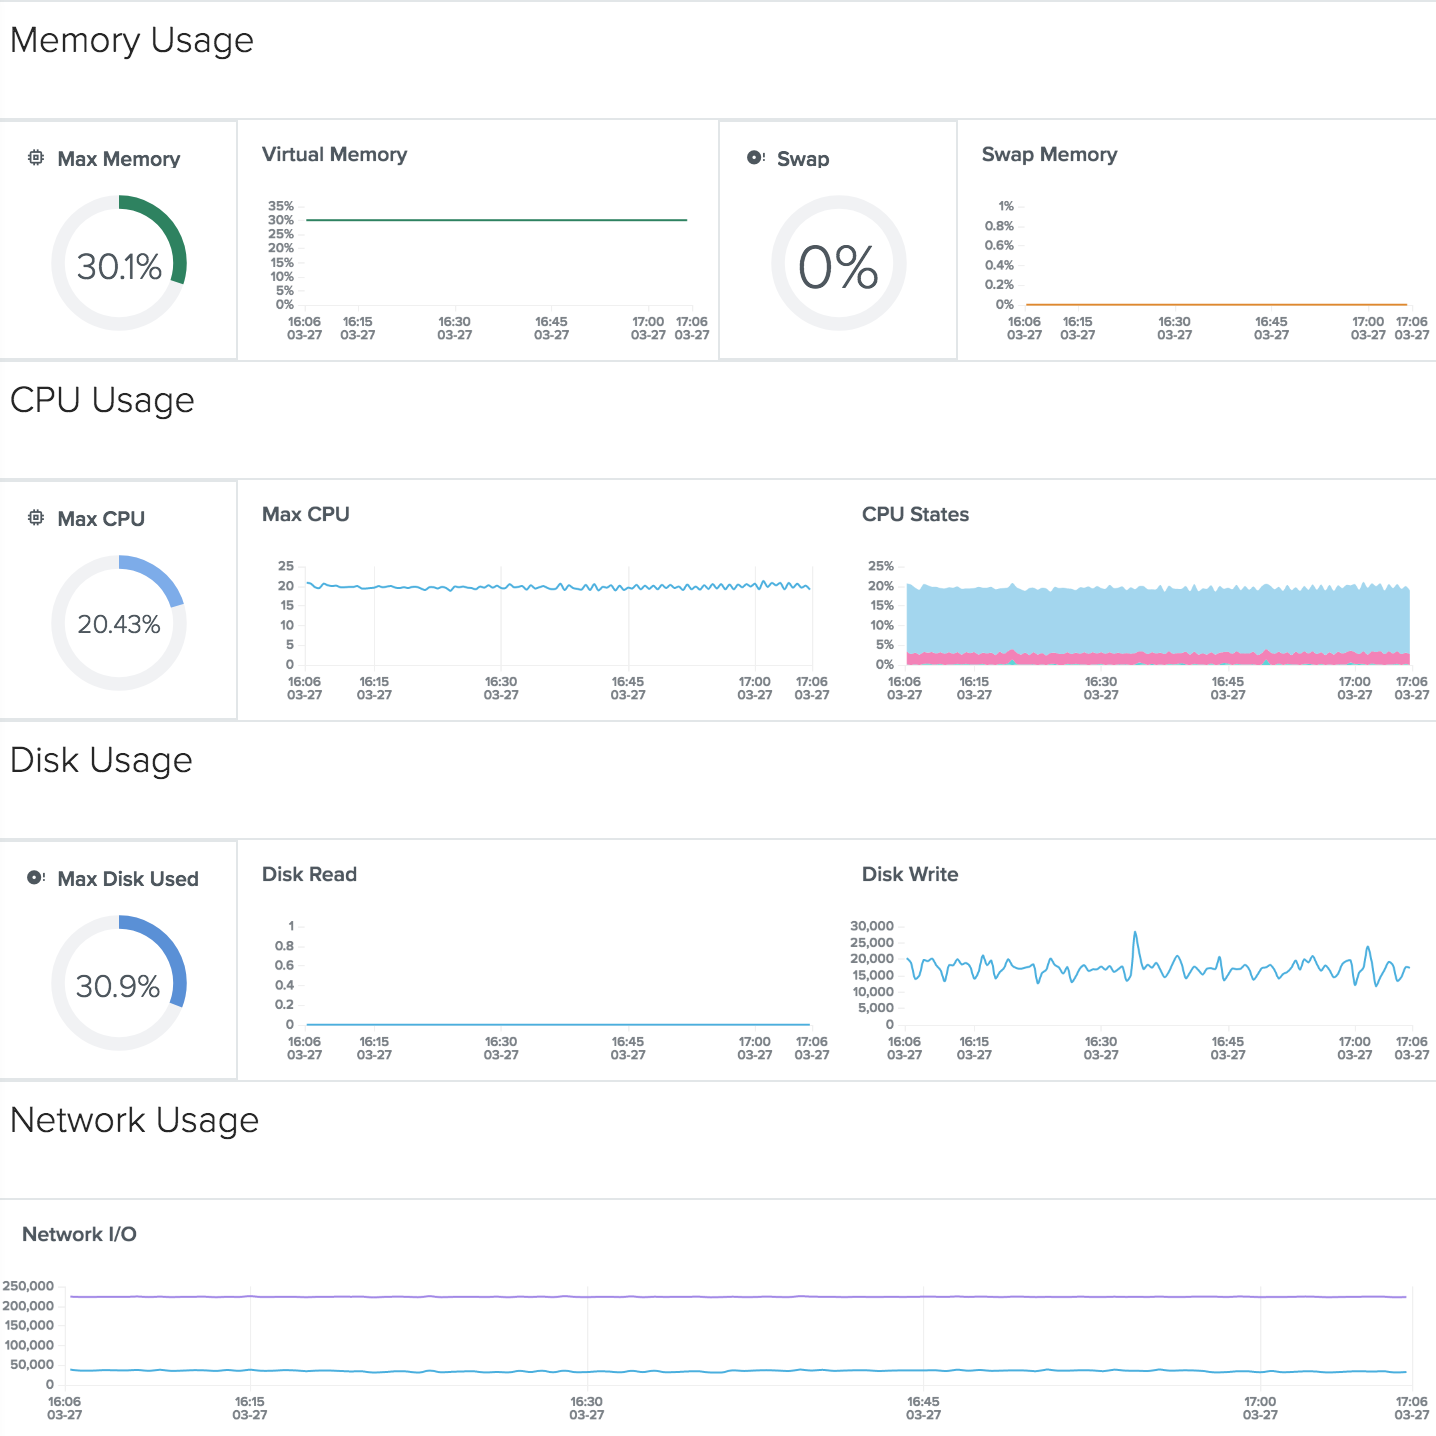 Outlyer Hosts Dashboard: Core Metrics
If you are monitoring your cluster using Prometheus and Grafana, the node core metrics are exposed by the node_exporter.
Kubelet Eviction Policies
The Kubelet is the agent daemon that runs on each node to manage container lifecycle among other responsibilities. When the node runs out of resources (especially incompressible resources such as memory or disk space), the Kubelet evicts one of the running Pods to free memory on the machine (this decision is made by the algorithm implemented in the Scheduler).
The Kubelet either evict Pods when the node exceeds the --eviction-hard threshold or the --eviction-soft threshold for more than --eviction-soft-grace-period. All these options are configurable in Kubelet.
Whenever a soft or hard eviction threshold is met (in other words, when Kubernetes receives an eviction signal), the Kubelet reports a condition that reflects the node is under MemoryPressure or DiskPressure. And why is that important? Because no new Best-Effort Pod (you will learn what a Best-Effort Pod is in the next section) is scheduled to a node that has MemoryPressure and no new Pod (regardless of its QoS class) is scheduled on a Node that has DiskPressure.
You can either directly query the API Server to retrieve information about your nodes conditions or simply gather the kube_node_status_condition metric via kube-state-metrics.
 Outlyer Cluster Overview Dashboard: Memory and Disk Pressure
Kubernetes Quality of Service (QoS)
Kubernetes assigns a particular Quality of Service (QoS) class to a Pod depending on its requests and limits specification, being 0 <= request <= Node Allocatable and request <= limit <= Infinity.
We say the system is overcommited when the sum of limits > Node Allocatable. When the system is overcommited, containers might eventually have to be killed to free resources on the machine.
QoS classes are classified into three categories: Guaranteed, Burstable and Best-Effort. As mentioned earlier, when a node is under the MemoryPressure condition, the Kubelet evicts Pods to free memory on the machine. The decision of what Pod will be killed is highly coupled to its QoS class.
As you probably guessed it, Guaranteed > Burstable > Best-Effort, which means a Guaranteed Pod is guaranteed to not be killed until it exceeds its limits or the system is under memory pressure and there are no lower priority Pods (Burstable or Best-Effort Pods) that can be killed. More precisely:
- Best-Effort Pods will be treated as the lowest priority. Processes in these Pods are the first to get killed if the system runs out of memory. These containers can use any amount of free memory in the node though.
- Guaranteed Pods are considered top-priority and are guaranteed to not be killed until they exceed their limits, or if the system is under memory pressure and there are no lower priority containers that can be evicted.
- Burstable Pods have some form of minimal resource guarantee but can use more resources when available. Under system memory pressure, these containers are more likely to be killed once they exceed their requests and no Best-Effort Pods exist.
That’s especially important when it comes to Kubernetes monitoring because you don’t want your Pods being evicted due to containers exceeding their memory limits. The next section shows which metrics expose container request, limit and current memory usage.
Pods will not be killed if CPU guarantees cannot be met (for example if system tasks or daemons take up lots of CPU), they will be temporarily throttled (that’s why the metric container_cpu_cfs_throttled_seconds_total is listed in the next section).
Just out of curiosity, Borg increased utilization by about 20% when it started allowing the use of such non-guaranteed resources.
Interested in trying Outlyer for monitoring Kubernetes? We offer a 14-Day Free Trial – No credit card needed, get set up in minutes. Read The Docs to get started in minutes.
Core Metrics: Pods/Containers
Most of the core metrics for Pods/Containers can be extracted from Kubelet (via cAdvisor) and kube-state-metrics. The table below shows a subset of relevant metrics grouped by resource.
| Metric | Resource | Description | Source |
|---|---|---|---|
| container_memory_usage_bytes | Memory | Current memory usage in bytes. | cAdvisor |
| kube_pod_container_resource_requests_memory_bytes | Memory | The number of requested memory bytes by a container. | kube-state-metrics |
| container_spec_memory_limit_bytes | Memory | Memory limit for the container. | cAdvisor |
| container_memory_swap | Memory | Container swap usage in bytes. | cAdvisor |
| container_spec_memory_swap_limit_bytes | Memory | Memory swap limit for the container. | cAdvisor |
| container_cpu_load_average_10s | CPU | Value of container cpu load average over the last 10 seconds. | cAdvisor |
| container_cpu_usage_seconds_total | CPU | Cumulative cpu time consumed per cpu in seconds. | cAdvisor |
| kube_pod_container_resource_requests_cpu_cores | CPU | The number of requested cpu cores by a container. | kube-state-metrics |
| kube_pod_container_resource_limits_cpu_cores | CPU | The limit on cpu cores to be used by a container. | kube-state-metrics |
| container_cpu_cfs_throttled_seconds_total | CPU | Total time duration the container has been throttled. | cAdvisor |
| container_fs_usage_bytes | Filesystem | Number of bytes that are consumed by the container on this filesystem. | cAdvisor |
| container_fs_limit_bytes | Filesystem | Number of bytes that can be consumed by the container on this filesystem. | cAdvisor |
| container_fs_writes_bytes_total | Filesystem | Cumulative count of bytes written. | cAdvisor |
| container_fs_reads_bytes_total | Filesystem | Cumulative count of bytes read. | cAdvisor |
| container_network_receive_bytes_total | Network | Cumulative count of bytes received. | cAdvisor |
| container_network_transmit_bytes_total | Network | Cumulative count of bytes transmitted. | cAdvisor |
| container_network_receive_errors_total | Network | Cumulative count of errors encountered while receiving. | cAdvisor |
| container_network_transmit_errors_total | Network | Cumulative count of errors encountered while transmitting. | cAdvisor |
For example, using the metrics container_memory_usage_bytes and container_spec_memory_limit_bytes you can easily set an alarm to get notified whenever a container current memory usage reaches 80% of its specified memory limit.
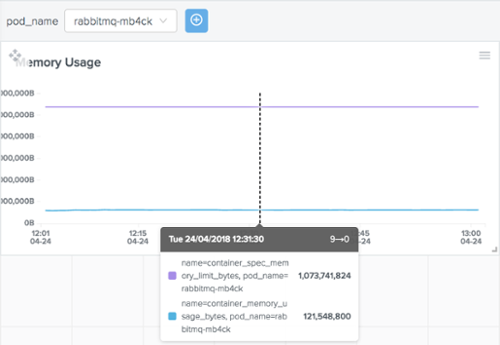 Outlyer Pods Dashboard: Pod Current Memory vs Pod Memory Limit
Kubelet
The Kubelet /metrics endpoint provides (among many others) metrics on the total number of Pods running in the node, which can be combined with the metric kube_node_status_capacity_pods from kube-state-metrics to give you visibility on the capacity of Pods in your cluster:
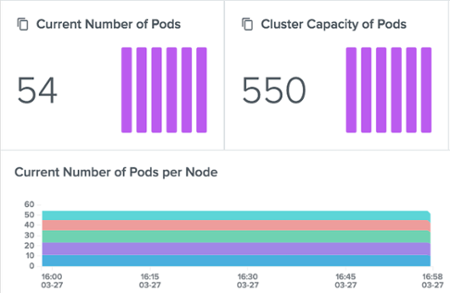 Outlyer Cluster Overview Dashboard: Cluster Capacity of Pods
Other important Kubelet metrics include the number of containers running in the node and the number/latency of Kubelet operations:
| Metric | Description | Source |
|---|---|---|
| kubelet_running_container_count | Number of containers currently running. | Kubelet |
| kubelet_runtime_operations | Cumulative number of runtime operations by operation type. | Kubelet |
| kubelet_runtime_operations_latency_microseconds | Latency in microseconds of runtime operations. Broken down by operation type. | Kubelet |
Control Plane Status
It’s crucial to keep track of Control Plane components (API Server, etcd, Controller Manager and Scheduler) by querying their health check endpoint. Part 2 shows where to find the health check endpoint for each component in your cluster.
 Outlyer Cluster Overview Dashboard: API Server and etcd Status
API Server
The API Server is the main management point of the entire cluster.
Besides monitoring its status, it’s also important to keep track of the number of requests received and their associated latency (especially those with HTTP response code 500). It’s also useful to group the request latencies by HTTP verb as shown below.
| Metric | Description | Source |
|---|---|---|
| apiserver_request_count | Counter of apiserver requests broken out for each verb, API resource, client, and HTTP response contentType and code. | API Server |
| apiserver_request_latencies | Response latency distribution in microseconds for each verb, resource and subresource | API Server |
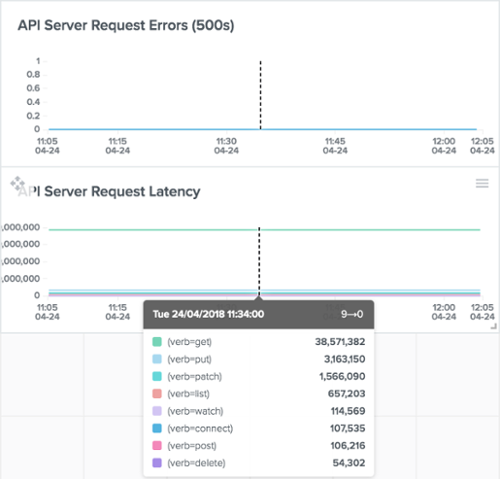 Outlyer Cluster Overview Dashboard: API Server Request/Latency
Other important API Server metrics include performance of controller work queues, etcd cache performance and Golang stats like duration of GC invocations (go_gc_duration_seconds), number of OS threads (go_threads), current number of goroutines (go_goroutines), etc.
Etcd
Etcd is a distributed, consistent key-value store used for configuration management, service discovery, and coordinating distributed work. In Kubernetes, etcd reliably stores all the configuration data of the Kubernetes cluster that represents the cluster state.
Etcd is written in Go and uses the Raft consensus algorithm to manage a highly-available replicated log. The Consensus problem involves multiple servers agreeing on values; a common problem that arises in the context of replicated state machines. Raft defines three different roles (Leader, Follower, and Candidate) and achieves consensus via an elected leader, which means that monitoring leader activity and Raft proposals are extremely relevant in etcd.
It’s also important to monitor etcd database size, disk write latency, network received and sent bytes and RPCs failures. You can easily achieve that by using the metrics listed below, which are exposed by etcd /metrics endpoint:
| Metric | Description | Source |
|---|---|---|
| etcd_server_has_leader | Whether or not a leader exists. 1 is existence, 0 is not. | etcd |
| etcd_server_leader_changes_seen_total | The number of leader changes seen. | etcd |
| etcd_server_proposals_applied_total | The total number of consensus proposals applied. | etcd |
| etcd_server_proposals_committed_total | The total number of consensus proposals committed. | etcd |
| etcd_server_proposals_pending | The current number of pending proposals to commit. | etcd |
| etcd_server_proposals_failed_total | The total number of failed proposals seen. | etcd |
| etcd_debugging_mvcc_db_total_size_in_bytes | Total size of the underlying database in bytes. | etcd |
| etcd_disk_backend_commit_duration_seconds | The latency distributions of commit called by backend. | etcd |
| etcd_disk_wal_fsync_duration_seconds | The latency distributions of fsync called by wal. | etcd |
| etcd_network_client_grpc_received_bytes_total | The total number of bytes received from grpc clients. | etcd |
| etcd_network_client_grpc_sent_bytes_total | The total number of bytes sent to grpc clients. | etcd |
| grpc_server_started_total | Total number of RPCs started on the server. | etcd |
| grpc_server_handled_total | Total number of RPCs completed on the server, regardless of success or failure. | etcd |
Just like the API Server, it’s also important in etcd to keep track of Golang stats.
Metrics from kube-state-metrics
The kube-state-metrics is a simple add-on service that listens to the API Server and generates tons of metrics for all Kubernetes resources (Deployments, StatefulSets, CronJobs, Pods, etc). In the Kubelet Eviction Policies section, we have already seen a dashboard built on top of kube-state-metrics showing node DiskPressure and MemoryPressure.
Another useful example of kube-state-metrics metrics is monitoring Pods phases (Pending, Failed, etc), waiting reasons (CrashLoopBackOff, ErrImagePull, etc), terminated reasons (OOMKilled, ContainerCannotRun, etc) and the number of container restarts per Pod.
| Metric | Description | Source |
|---|---|---|
| kube_pod_status_phase | The pods current phase. <Pending|Running|Succeeded|Failed|Unknown> | kube-state-metrics |
| kube_pod_container_status_waiting_reason | Describes the reason the container is currently in waiting state. <ContainerCreating|CrashLoopBackOff|ErrImagePull | ImagePullBackOff> | kube-state-metrics |
| kube_pod_container_status_terminated_reason | Describes the reason the container is currently in terminated state. <OOMKilled|Error|Completed|ContainerCannotRun> | kube-state-metrics |
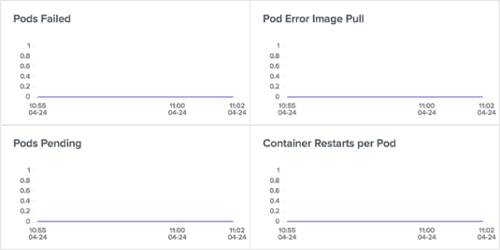 Outlyer Cluster Dashboard: Pods Events
Checking if the number of desired replicas matches the number of current replicas for a given Deployment is also useful.
| Metric | Description | Source |
|---|---|---|
| kube_deployment_spec_replicas | Number of desired pods for a deployment. | kube-state-metrics |
| kube_deployment_status_replicas | The number of replicas per deployment. | kube-state-metrics |
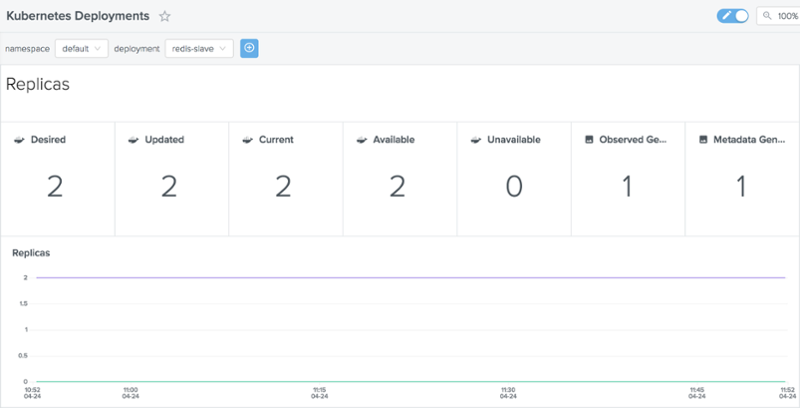 Outlyer Kubernetes Deployments Dashboard
Conclusion
This article describes a subset of relevant metrics you should consider when monitoring your Kubernetes cluster in order to anticipate issues that may eventually crash your applications.
Besides, as shown in the article, Outlyer provides many out-of-the-box dashboards (and alert definitions) to ensure your Kubernetes cluster is healthy and working properly.
Kubernetes Blog Series
- Part 1 Getting Started with Kubernetes Monitoring
- Part 2 Collecting Kubernetes Metrics with Heapster & Prometheus
- Part 3 How to Monitor Kubernetes with Outlyer
- Part 4 Key Kubernetes Metrics to Monitor
Interested in trying Outlyer for monitoring Kubernetes? We offer a 14-Day Free Trial – No credit card needed, get set up in minutes. Read The Docs to get started in minutes.