As a monitoring company, we rely on time-series databases (TSDBs) as a foundation for building a scalable and reliable monitoring solution. Over the past few years, we’ve gone through 3 iterations of our architecture as we scaled up with more metrics and more customers, and we haven’t always gotten it right. We’ve tested most of the open-source TSDBs out there, as well as attempted to build our own.
One could argue that through a lot of trial and error we’ve become experts in building TSDBs, and by now are very familiar with all the hidden ‘landmines’ of doing so at scale. That is why I want to share our journey. It seems that every week yet another new open-source TSDB is released so this blog may help some of you avoid the mistakes we made along the way.
This blog is based on a talk I did at our recent DOXSFO meetup so you can either watch the video or continue reading below:
Our Journey To Building Something That Works & Scales
Version 1: 2013-2015
When we started back in 2013, analytics and containers seemed quite far off on the horizon. At the time we had a very small team, so we opted for the simplest solution of just storing metrics and data points. We knew it had to be reliable and performant, and due to the size of our team, having something operationally resilient and easy to manage was essential to us.
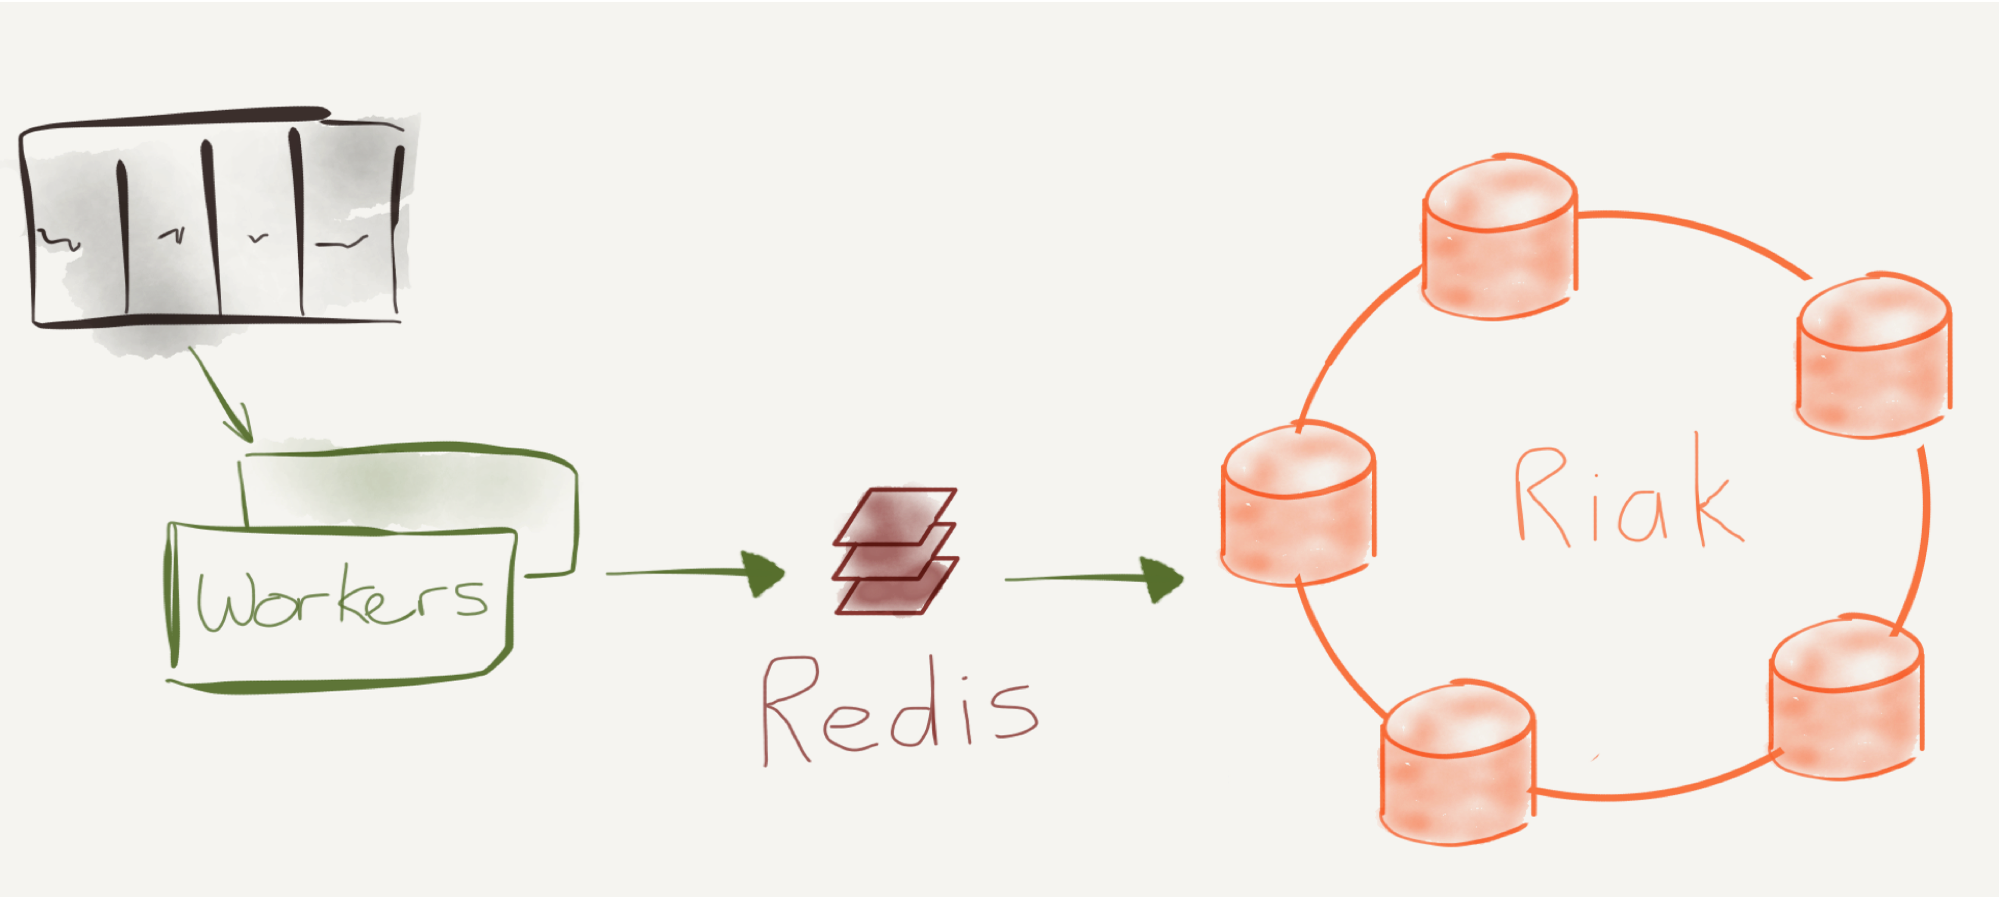
That led us to build our first architecture on Riak. Although Riak is a simple key/value store, Riak Core, built in Erlang, is very reliable and performant. During testing, we literally killed and replaced nodes, and Riak ‘magically’ redistributed the data and continued running without any outages.
It worked well for the first year as we built out the first version of Outlyer, but as we added more and more users, we started experiencing performance issues. Then we did what all good engineering teams do when hitting scaling issues, and put the in-memory cache Redis to act as a write buffer and a quicker source to query for the latest metrics that were coming in.

Version 2: 2015-2017
Version 1 worked really well for the first year and a half, but by 2015 the limitations of it started to become apparent. As more advanced analytics and containers became a fast approaching reality, our product had to advance towards more complex analytics capabilities and dimensional metrics.
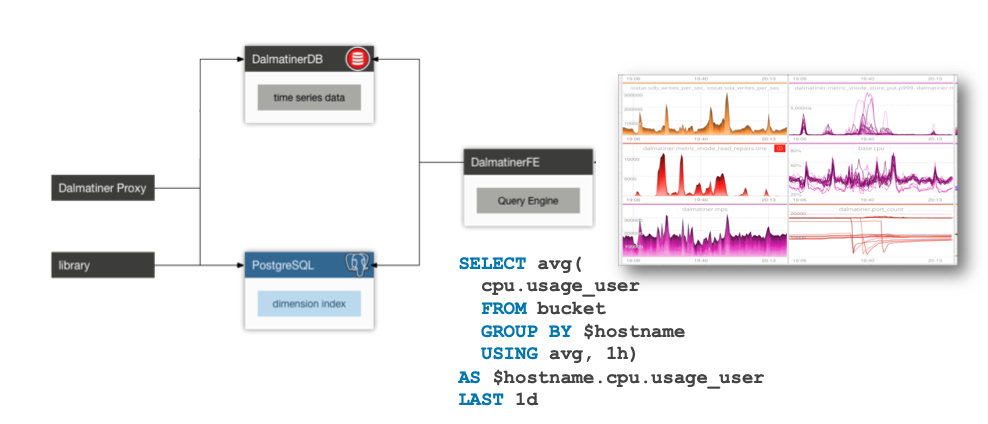
Riak out of the box, being only a key/value store, only allowed us to do simple, non-dimensional metrics (metric names with no ability to label metrics). We knew we had to add this capability, as well as a query layer that would enable us to do advanced queries such as adding and dividing time-series together, calculating percentiles on the fly, and other common queries you’d expect from a TSDB.
We had a choice of either building it ourselves on top of Riak or bringing in another solution already out there. We looked at the obvious solutions at the time like InfluxDB - we knew the founder Paul and liked it a lot, but its lack of clustering and maturity in 2015 didn’t convince us we could use it for our needs (they’ve made tremendous progress since).
Along the way, we stumbled across a TSDB created by the talented Heinz Gies, called DalmatinerDB. Heinz is a brilliant and accomplished Erlang programmer, and had taken the best part we liked about Riak, Riak core, and built a TSDB around it with a query engine that could do advanced analytics on top. It didn’t support dimensional metrics when we found it, but the team was excited to use Erlang based on based on WhatsApp’s success at scale). Our initial testing showed a single node could write 3 million metrics/second. We felt confident we could take DalmatinerDB, make it our own and become the main contributors to the project. We even contracted Heinz in to help, essentially sponsoring its development, and worked closely with him to add a new PostgreSQL index so we could support dimensional labels on metrics.

At that point, our journey stumbled. We continued to grow and add some new large customers, and since DalmatinerDB had never operated at the scale we were at, all the non-obvious issues of building a TSDB started to appear quickly. We hit some pretty bad performance issues that we ultimately fixed, but only by putting our entire engineering resources onto the problem. It felt like peeling an onion - as soon as we fixed one performance problem, the next layer would reveal another issue underneath.
Without going into the full detail of the challenges we hit, here is a summary:
- No Sensible Limits: There were no real limits or protections around what customers could send us in our architecture. That really hit us when one team at one of our customers decided to send all of their mobile product metrics into Outlyer and dumped 30 million metrics on us. It immediately put our team into fire-fighting mode trying to operate at another level of scale we weren’t expecting to hit until much later.
- Container Churn: As containers became more prevalent in 2016, we started to see some container environments churning containers every 6 minutes in some cases leading to the problem of Series Churn (see more below), and our PostgreSQL index exploded as it had to index more metrics, slowing down our ability to query for metrics.
-
Conflicting Write & Read Architectures: While we were blown away with being able to write 3 million metrics/second on DalmatinerDB in our initial testing, we ran into a challenge that any TSDB needs to handle - balancing the ideal patterns for writing and reading data in parallel at scale. Fabian Reinartz from Prometheus put it elegantly:
“There’s obviously a strong tension between the ideal pattern for writing collected data to disk and the layout that would be significantly more efficient for serving queries. It is the fundamental problem our TSDB has to solve.”
We experienced this problem a lot on DalmatinerDB as we scaled. While we were able to write metrics at scale, the same architecture that enabled us to achieve such high write volumes, really hurt us when we tried to query the data back to users. For example, DalmatinerDB didn’t push queries down to the nodes, which meant it had to pull all the data points for a query across our network to the query engine, which would then calculate the time-series the user saw based on the query. It meant that we started seeing network IO bottlenecks as at times 40GB of raw data points would be pulled in for a single query!
In the end, after investing a lot of time and resources, we did the other engineering solution that teams take to solve scaling issues, and essentially sharded all our largest customers onto separate DalmtainerDB clusters. It stopped the fires, but we knew that unless we were going to become a time-series database company, we would have to take an approach fundamentally different to ‘peeling the onion’ and hitting all the other unknown scaling issues as we grew.
The good news is during this time, as we were also writing and helping design the TSDB, we had learned the hard way how to scale and operate a TSDB, and could take that knowledge to do something that would actually work for us.
Why Building a TSDB is Hard
Monitoring has become a hard problem to solve as our architectures have evolved towards Cloud, Containers, and Microservices. The number of metrics seems to increase exponentially every year as more and more companies move towards these architectures. The single-node solutions we used to rely on (i.e., Nagios or Graphite) simply don’t scale anymore, at least not without a significant amount of time and effort, effectively requiring full-time resources to build and manage at scale.
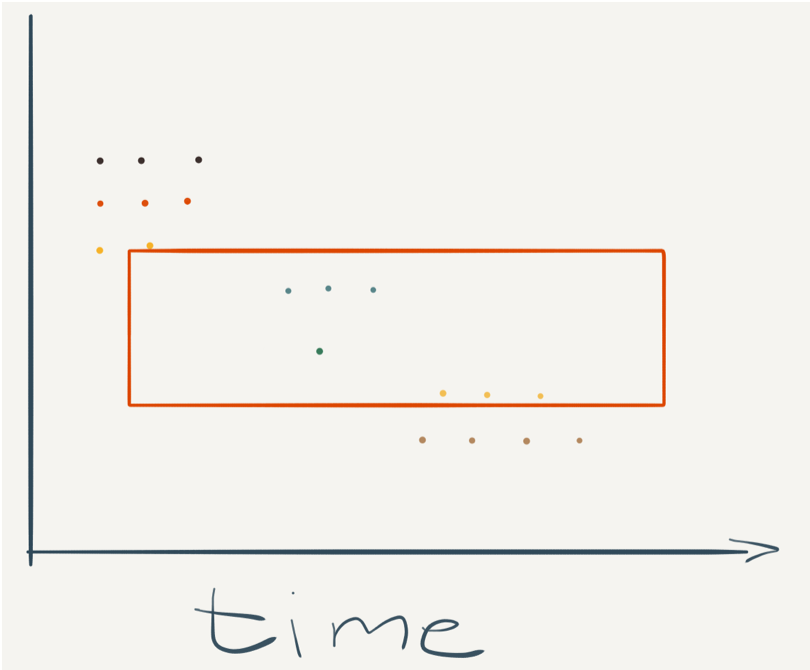
This growth in metrics is often referred to as cardinality. Every unique set of metric name and metric labels represents a single metric. Whereas in 2013 our largest customers would send us 100,000 metrics (which was considered a lot at the time), nowadays it’s not uncommon for some of our customers to send us millions of metrics every minute. With every new service, every new node or container, the number of metrics grows, and your solution needs to scale too. For example, Kube-State-Metrics for Kubernetes can easily generate over 100,000 metrics on a single cluster, and many organizations have multiple clusters.
At this volume, an entirely new architecture is needed, not only in the way you store and query your metrics but also because single-node architectures don’t cut it anymore. If you want to scale, stay reliable and maintain performance, you end up having to move to a far more complex multi-node architecture to keep up with this volume of metrics.
In addition, you have to meet the expectations of your users, primarily developers, who have grown used to instant search results on Google and expect to be able to send as many metrics as they want, and being able to query them in sub-second response times. As Amy Nguyen from the Pinterest observability team has mentioned in her excellent Monitoring Design talk, “Do whatever it takes to make it fast.”
The problem gets even harder as our environments became even more ephemeral with containers. Now the solution has to handle a problem called Series Churn. For example, if each container generates 50 metrics to monitor its performance (i.e., CPU, memory, etc.), that container ID label on your metrics will change every time your containers start and stop, adding another 50 metrics to your index each time, that only existed for the time that container was up and running. If you don’t design for this, you will see your metrics index grow extremely large very fast as we did on DalmatinerDB.

There are some properties of time-series data however, especially for our use-case, IT monitoring, which can be leveraged to make the problem far simpler to solve:
- Most Data Is Only Queried In The Last Hour: We analyzed our queries back in 2016 and found that the value of data decreases exponentially after only just one hour, with over 90% of the queries only looking at the last hour of data. It means you can focus most of your efforts on solving for the newest data, and put anything older onto cheaper, albeit slower, storage and architectures.
- Datapoints Are Immutable: Most datapoints come into your monitoring system in order or at least can be organized into order over a short period, and once written don’t need to be touched again. It means you don’t need to build expensive ACID database transactions or worry about inserts and updates once the data is written, making the way you store data much more straightforward.
- You Can Lose a Few Datapoints Here and There: At high volume, losing a handful of data points is just not noticeable on graphs and alerts. While you want to ensure you store as many of the data points as possible, designing a system that guarantees every data point must be written is a much harder problem to solve. Accepting that it’s OK to lose some data points in extreme scenarios simplifies the problem without affecting the end user’s monitoring in any noticeable way.
- Most Datapoints Don’t Change Much Between Readings: Facebook wrote a paper on this for their own TSBD, Gorrilla DB. As many data points will be the same as the last reading or only change slightly, this lends itself well to compression, which allows you to shrink your storage resources substantially.
These challenges, as well as the properties of time-series data discussed above, led us to create a brand new architecture for our TSDB that became the backbone of our latest version of Outlyer we recently released.
Version 3: Our New TSDB Architecture
When we decided to move off DalmatinerDB in 2017 and redesign our architecture from the ground up to ensure we didn’t hit the same scaling and performance issues again, we made two critical decisions that helped us design the new TSDB architecture:
- Whatever technologies we used needed to have been proven themselves at a larger scale than our current needs. It would mean we could scale up without being the first person to hit technical issues with the technology and having to solve them ourselves, as other people would have resolved those issues already.
- As a SaaS solution, we could build a more distributed architecture than if we had to provide the solution on-premise and worry about making it easy to install. What this ultimately means is we can separate the concerns of the TSDB into separate microservices and processes that we could scale and evolve independently. It is in contrast to a monolithic solution which may have a low setup cost but quickly becomes a full-time job to operate and manage at scale. While DalmatinerDB did separate key parts into different services, we wanted to take this further so we could switch and replace components with higher granularity on the fly as our scale grew.
We performed another evaluation of all the TSDBs out there, looking again at InfluxDB, but also newer solutions that had appeared since 2015 such as Beringei (Gorrilla DB) from Facebook and Atlas from Netflix.
Given our experience, we were very skeptical about all the mind-blowing claims that every single TSDB we researched was making. We saw there was no one “perfect” TSDB. Each solution had its pros and cons, and the dream of having a solution that you can simply write metrics into and scale up linearly is just that, a dream. That is why there seems to be a new TSDB released every week: you can find issues with everything out there.
As our key requirement was that we wanted something that had been battle-tested in production at significant scale already, and we already had a relationship with Roy Rapoport who used to head up monitoring at Netflix and had spoken at our DOXSFO meetup before, we and ultimately decided to go with Atlas, which is written in Scala. The things we liked most about Atlas were the fact that Netflix had been using it for several years to collect and query billions of metrics a day, the fact that it had sensible limits built in, and that it was in-memory so performed super fast when we tested it.
We have learned that Atlas by itself is a component, not the full solution. It doesn’t try to do everything like shared state and replication; every Atlas node is independent. This solves a lot of complexity and performance issues as the volume of metrics grows, but requires a lot more tooling to manage Atlas at scale. Because we store 13 months of metrics for customers, as opposed to only 4 weeks like Netflix does, putting this all in memory for the full period would have been cost prohibitive so we had to add disk-based storage to our long-term nodes, which was fine as most of the metrics on these nodes would only be queried from time to time.
Understanding this, and taking our lessons learned from Version 2, we were able to design a new architecture that has been running in production for our new release of Outlyer since January. The key design concepts are:
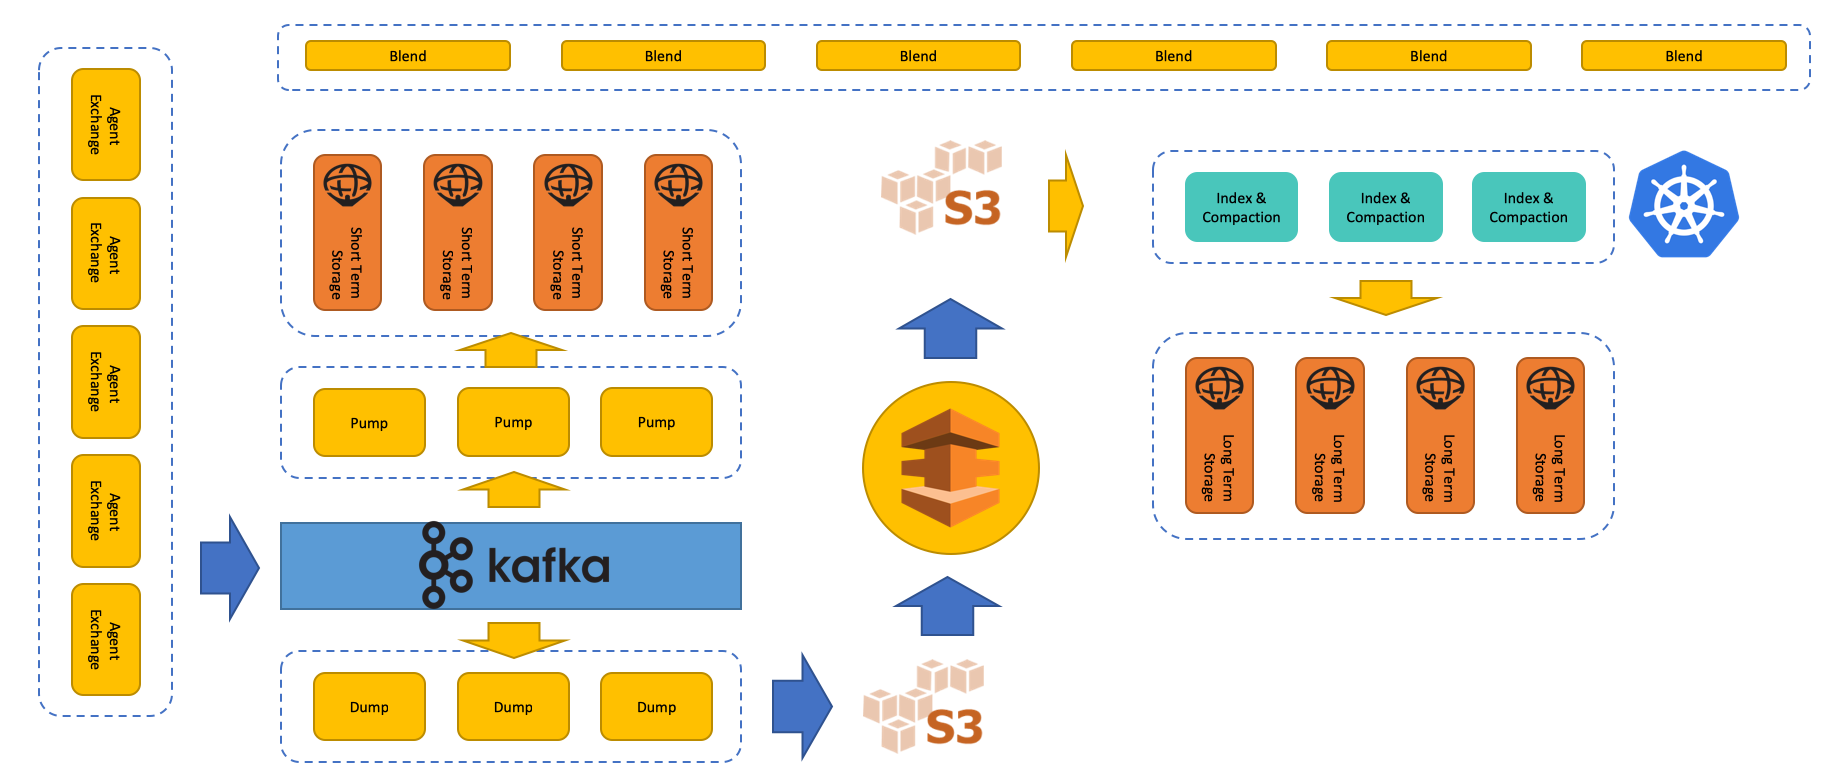
- Multi-Tier Architecture: Knowing that the most recent data is the most frequently queried, we decided to split our architecture into separate tiers based on the retention period of the data. The most recent data is stored on in-memory nodes and loaded with new data points in real time so they can be queried instantly for the majority of users, while older data is stored on cheaper, slightly slower disk-based nodes. Having multiple tiers also solves the issue of Series Churn, as old series get removed from the short-term tier within a few hours, stopping the index from growing infinitely.
- Backup to S3: In parallel, the raw metrics are also written to Amazon S3, which uses Spark along with scheduled processes in Kubernetes to perform rollups for the longer term tiers. Using durable and reliable S3 storage as an immutable source of truth separates the concerns of short and retention. This means if we have issues on any tier, other tiers will continue working unaffected. In addition, we have a full backup of all the original data which we can use to regenerate tiers and reload instances from scratch in minutes if we spot an issue with one of our tiers. We can also use the raw data to run batch reports for users about their environments later on.
- Sharding Everywhere: We built dynamic sharding into the architecture using Consul from day one. This means our larger customers can be put onto separate shards, which we can independently scale and tune to their needs, and all our smaller customers can be put on a single shard so we can support them cost effectively too. As customers grow, it’s straightforward to move them to their own shard without them noticing anything, and because each shard is dynamically configurable via Consul, we can also provide customers with “personalized” retention settings, i.e., store metrics at any resolution they want, for however long they want so they can control their costs on Outlyer too.
- Mirrors Vs. Clustering: Clustering adds a lot of complexity and overhead to solutions as we saw with DalmatinerDB. Eventually, your performance bottleneck will be the amount of chatter between nodes trying to sync data across your network. Therefore, every Atlas instance in our short-term tier is an independent mirror across availability zones. This means we have at least two nodes with the same data for each shard, but if one goes down, the other node can handle the load while we automatically recreate and reload the data into the other node without users noticing. We’ve built all the tooling to do this automatically using Auto-Scaling groups, which means when we actually lose a node, the system recovers automatically without any service interruption or one of our team having to wake up to fix it (which actually happened a few nights ago and worked perfectly!).
As you can see below, the architecture uses Kafka and multiple microservices to process and query metrics, we’ve essentially unbundled the TSBD into granular services we can independently scale and evolve. The other service on the diagram called Blend is our query engine that handles queries from our API, and using Consul knows which nodes/tier portions of the query should be delegated. Blend then combines the responses into a single result which the user sees on a graph.
Note the difference between this approach and that of DalmatinerDB, where raw data was pulled from the storage nodes and aggregated later. Most of the work is delegated to the nodes, close to the data, with the pre-aggregated results combined by Blend.

While all the detail behind how this architecture works will be left for a separate blog by our core TSDB engineers Dave & Chris, the results so far have been fantastic. We’re scaling while loading queries in sub-second response times, with customers doing millions of metrics per shard. In fact, we haven’t had any fires yet, the architecture has so much built-in resiliency, that it auto-healed itself for the few issues we did have without any of our team members needing to wake up and fix things.
Conclusion
Hopefully, our story will make you think twice before trying to build your own TSDB in-house using open-source solutions, or if you’re really crazy, building a TSDB from scratch. Building and maintaining a TSDB is a full-time job, and we have dedicated expert engineers who are continually improving and maintaining our TSDB, and no doubt will iterate the architecture again over time as we hit an even higher magnitude of scale down the line.
Given our experience in this complex space, I would sincerely recommend you don’t try and do this at home, and if you have the money you should definitely outsource this to the experts who do this as a full-time job, whether its Outlyer or another managed TSDB solution out there. As so many things turn out in computing, it’s much harder than it looks!
Special Thanks
One of the advantages we also had in Version 3 was the immense help and support from the Netflix monitoring team, in particular, Brian Harrington who is the core author of Atlas and has got on calls with us several times to help us build a successful monitoring platform around Atlas. It really does take a strong team of super talented experts to build a TSDB that performs at scale, and it’s been awesome collaborating with Brian and the rest of the Netflix monitoring team!