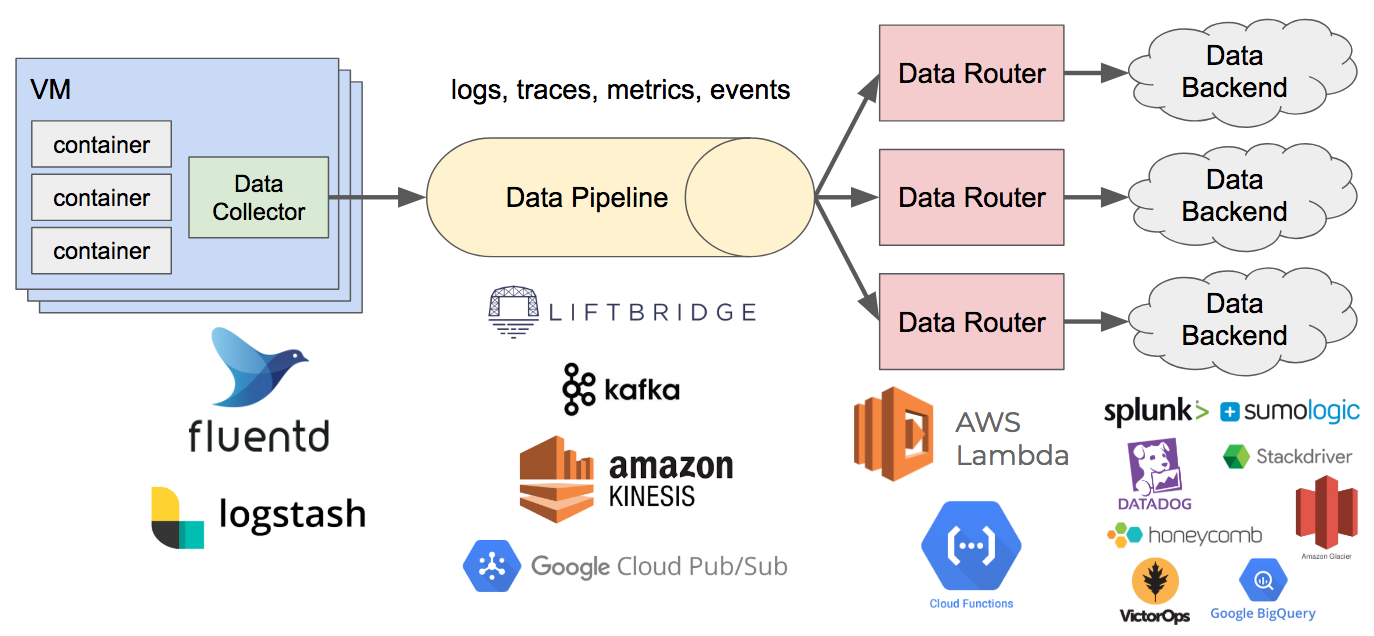
Recently a blog post on the Observability Pipeline has been doing the rounds, and its a great blog post sharing an increasingly common idea we’ve seen talked about even at our own meetup last August: JustEat’s What Does Next Gen Monitoring Look Like?.
It’s an attractive idea as monitoring starts to become standardised, and users don’t necessarily want to be locked into a specific provider that becomes a pain to migrate off later on if the bill gets too expensive or a better solution comes along. Essentially you push all your metrics, events, logs and tracing data to a common queue, and then have workers pull messages off that queue and push it into other solutions. In theory testing or migrating to another solution would be as simple as adding another consumer to the queue that pushes metrics to that solution. It could also enable you to control your bill by sending aggregated metrics/logs to hosted providers and dumping all the raw metrics or logs into cheaper solutions.
 Source: https://bravenewgeek.com/the-observability-pipeline
I can definitely see this working for “custom” data such as logs, custom metrics and tracing data, as the solutions that collect and analyse that data are generally designed for custom data. Traces are custom to your application architecture, custom metrics too, and logs too with open-source services generally outputing logs in a consistent format that can be relied upon.
However for infrastructure monitoring, the story becomes more complicated, and I would argue that trying to remove a solution’s agent for the benefit of being able to push metrics plug and play to different providers, will cause more issues than that value that solution provides.
Infrastructure Integrations Aren’t Standardized
The core problem is a lot of the time-savings and value of SaaS infrastructure monitoring solutions is quick time to value. You enable an integration with MySQL or Kafka, and in minutes you have a template dashboard showing you your key metrics, and potentially other features that rely on your metrics coming in with certain names and labels, and a certain query language to display them on your charts.
Every agent out there monitors 3rd party services uses different metric names and labels: Prometheus has recommended exporters for 3rd party services, but sometimes there are several, meaning you can’t rely on the same metric names and labels being collected for every service. CollectD sends different metrics, from Telegraph, which are different from Outlyer’s own agent etc.
Until every 3rd party service standardises their metrics the same way they generally output the same logs (perhaps by providing Prometheus endpoints that can simply be scraped by agents), you’ll find all the out-of-the-box integration templates with their dashboards and alerts won’t work, and you’ll then have to spend time building out your own custom dashboards and alerts for every solution as you migrate between them.
Combine that with an array of different query languages that each solution provides to get metrics out and chart them, you’ll find that your dashboards and all your queries will need to be completely recreated from scratch.
Also as more vendors like ourselves start applying machine learning to help users spot annomalies and issues, the problem of context is a lot easier to solve if you collect the same metrics for each integration, and not getting the same metrics would fall to more generalised approaches, which we’ve seen in the past just don’t work very well at scale.
Rolling out a new agent is the easy part. Most of the time migrating between solutions is because all the dashboards, alerts and queries need to be recreated from scratch manually. I have seen most large migrations take 6 months or more, as users generally have to manually migrate and recreate all their existing dashboards and alerts in the new solution, using its query language. This can be reduced if you use their 3rd party monitoring integrations, but to get those you will need to roll out a new agent that sends metrics the way the solution is expecting.
Massive Bills
In addition, one monitoring solution in particular, have per host pricing that will enable you to monitor out-of-the-box integrations in that per host price, with additional metrics being charged additionally as “custom metrics”, which can grow your bills substantially.
If you start sending all your metrics with different names/labels from what they expect from their own agent, then all your metrics will be treated as “custom metrics” and your bills will shoot up substantially.
Although this is specific to that provider, other providers have followed this route as well, and the only way to avoid this bill shock would be to use their integrations and ultimately their agent.
Losting Specific Value-Add Features
Another reason this approach doesn’t work for some solutions like Outlyer, is the agent actually provides some really powerful value-add features. In our case our core value proposition is “self-service”, you deploy the agent and then delegate the monitoring setup to all your teams using our push configuration technology. Other solutions I’ve seen provide live process monitoring, which would be lost without using their agent.
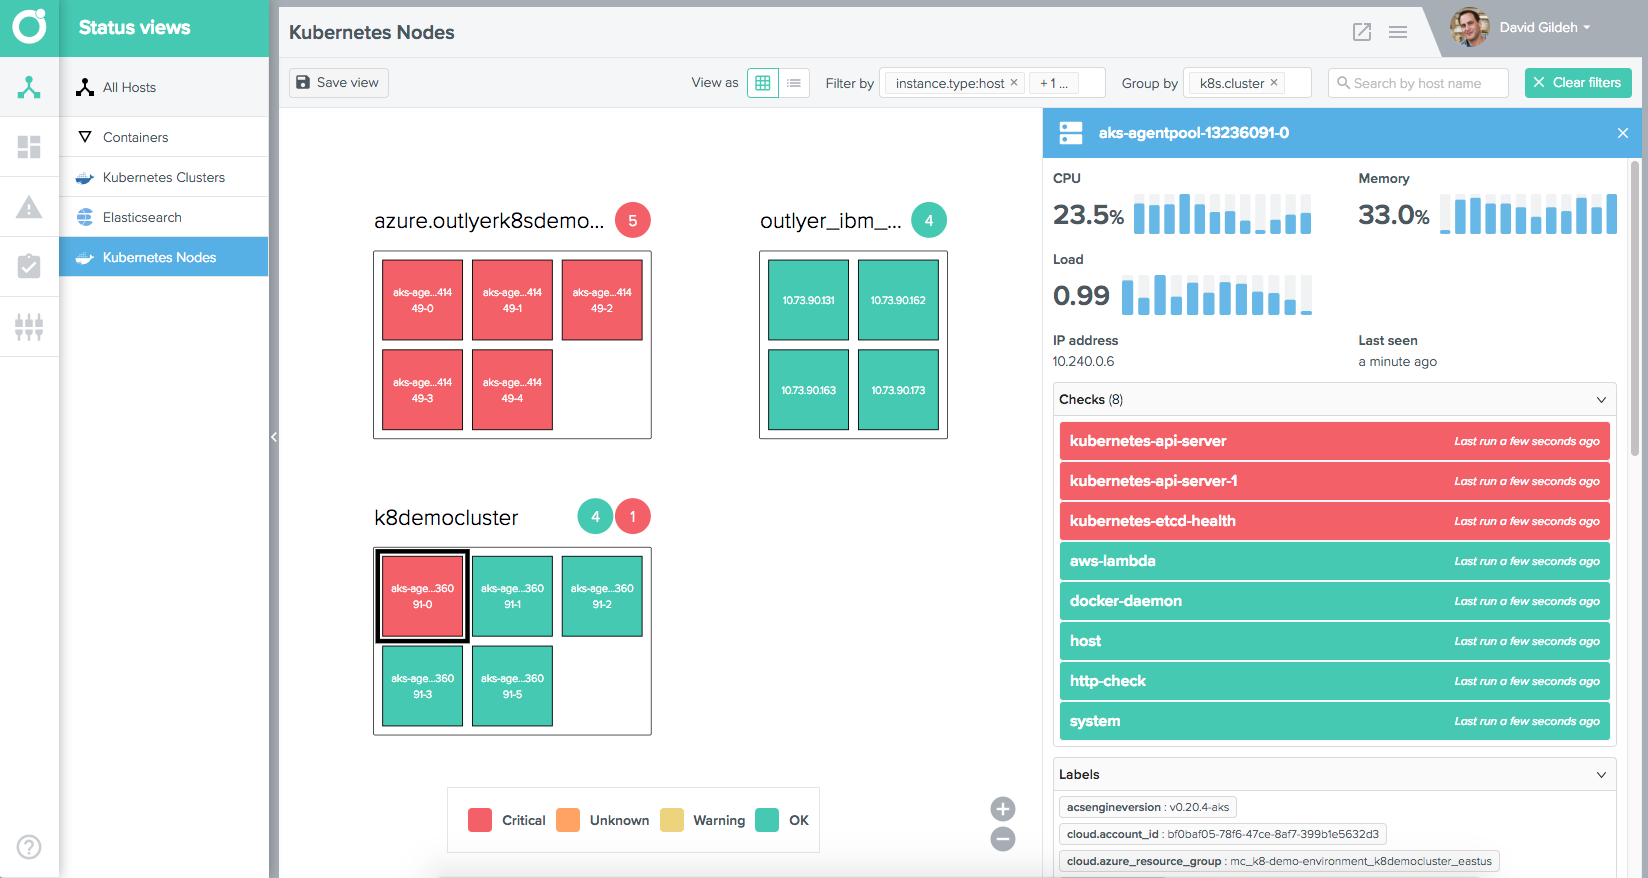
Also our host view which we automatically create to allow users to explore their environment and automatically discovers all the labels and metadata about those instances to help users troubleshoot issues would break if our agent wasn’t being used.

By teating monitoring vendors as metric/event sinks, essentially hosted time-series databases, you would lose a lot of the value those solutions can provide in addition to the quick easily integration installs and templates they provide out of the box.
Summary
As I’ve said, this idea has started to get traction, and I understand the attraction of this approach to end users who want more control over their bills and trying out new solutions. But I would argue, at least for infrastructure monitoring, this approach will cause more issues than the problems its trying to solve.
Maybe use this for logs, and traces and custom metrics, but for everything else, an agent will most likely make your job a hell of a lot easier!